Freedom High School

No Reviews Yet
Find Old Friends From Freedom High School
Use the form below to search for alumni from Freedom High School.
School Description
School Summary and Highlights
- Enrolls 2,378 high school students from grades 9-12
- Ranks 439th out of 1,197 high schools in CA.
- 2010 Overall School AYP Met Status: No
Additional Contact Information
- Mailing Address: 1050 Neroly Rd., Oakley, CA 94561
School District Details
- Liberty Union High School District
- Per-Pupil Spending: $8,421
- Dropout Rate: 1.6%
- Students Per Teacher: 23.7
- Enrolled Students: 7,258
Faculty Details and Student Enrollment
Students and Faculty
- Total Students Enrolled: 2,378
- Total Full Time "Equivalent" Teachers: 105.0
- Average Student-To-Teacher Ratio: 22.6
Students Gender Breakdown
- Males: 1,206 (50.7%)
- Females: 1,172 (49.3%)
Free Lunch Student Eligibility Breakdown
- Eligible for Reduced Lunch: 69 (2.9%)
- Eligible for Free Lunch: 506 (21.3%)
- Eligible for Either Reduced or Free Lunch: 575 (24.2%)
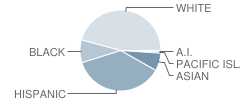
Student Enrollment Distribution by Race / Ethnicity

| Number | Percent | |
|---|---|---|
| American Indian | 18 | 0.8% |
| Black | 218 | 9.2% |
| Asian | 171 | 7.2% |
| Hispanic | 865 | 36.4% |
| White | 1,070 | 45.0% |
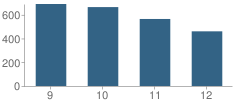
Number of Students Per Grade

| Number | Percent | |
|---|---|---|
| 9th Grade | 690 | 29.0% |
| 10th Grade | 664 | 27.9% |
| 11th Grade | 564 | 23.7% |
| 12th Grade | 460 | 19.3% |
Graduates Information (2010)
Graduation Rate
School:
97.1%
District:
93.6%
State:
78.6%
Teacher Education Background (2009)
Percent With Ph.D.: 87.0%
Percent With Master's Degree: 13.9%
Percent With Bachelor's Degree
School:
16.5%
District:
12.5%
Teacher Credentials & Experience (2009)
Percent of Teachers With Credentials: 93.2%
Number of Certificated Staff: 115.0
Average Number of Years of Teacher Experience: 11.4
Average Age
School:
40.2
District:
50.9
Source: CA Department of Education, Source: NCES 2009-2010
School Ratings and Reviews
Be The First To Review Freedom High School!
Sponsored Links
Test Scores and Performance Information
Overall School Rating
How is this determined?
The overall school rating shows that Freedom High School performed on average about the same as other schools across the state on CST state exams in the following subjects:
- CST Algebra I
- CST Algebra II
- CST Biology
- CST Chemistry
- CST Earth Science
- CST English-Language Arts
- CST Geometry
- CST Physics
- CST Science
- CST Summative High School Math
- CST U.S. History
- CST World History
AYP Results (2010)
Overall AYP Met: No
ELA AYP Met: No
Math AYP Met: No
ACT Exam Results (2009)
Percent of Students Taking ACT Exam: 13.1%
Average Combined Score: 21.4
Percent Scoring At or Above 21: 55.4%
SAT Exam Results (2009)
Percent of Students Taking SAT Exam: 30.7%
Average Combined Score: 1,456.8
Critical Reading Average: 489.3
Math Average: 481.1
Writing Average: 486.5
Percent Scoring At or Above 1500: 44.1%
CST - Test Proficiency by Grade and Subject
Grade 9 - % of students at or above proficiency
| School | District | State | |
|---|---|---|---|
| CST Algebra I Test | |||
| 2010 | 24.0% | 24.0% | 22.0% |
| 2009 | 12.0% | 17.0% | 21.0% |
| 2008 | 10.0% | 13.0% | 18.0% |
| CST Biology Test | |||
| 2010 | 84.0% | 79.0% | 55.0% |
| 2009 | 76.0% | 70.0% | 51.0% |
| 2008 | 71.0% | 73.0% | 52.0% |
| CST Earth Science Test | |||
| 2010 | 42.0% | 38.0% | 35.0% |
| 2009 | 24.0% | 26.0% | 29.0% |
| 2008 | 33.0% | 36.0% | 31.0% |
| CST English-Language Arts Test | |||
| 2010 | 56.0% | 61.0% | 54.0% |
| 2009 | 48.0% | 56.0% | 50.0% |
| 2008 | 49.0% | 57.0% | 49.0% |
| CST Geometry Test | |||
| 2010 | 35.0% | 27.0% | 46.0% |
| 2009 | 26.0% | 28.0% | 47.0% |
| 2008 | 41.0% | 27.0% | 43.0% |
Grade 10 - % of students at or above proficiency
| School | District | State | |
|---|---|---|---|
| CST Algebra I Test | |||
| 2010 | 17.0% | 13.0% | 12.0% |
| 2009 | 14.0% | 11.0% | 11.0% |
| 2008 | 1.0% | 4.0% | 9.0% |
| CST Algebra II Test | |||
| 2010 | 30.0% | 20.0% | 40.0% |
| 2009 | 31.0% | 14.0% | 37.0% |
| 2008 | 18.0% | 17.0% | 36.0% |
| CST Biology Test | |||
| 2010 | 47.0% | 37.0% | 38.0% |
| 2009 | 40.0% | 35.0% | 34.0% |
| 2008 | 39.0% | 39.0% | 35.0% |
| CST Chemistry Test | |||
| 2010 | 40.0% | 43.0% | 47.0% |
| 2009 | 48.0% | 43.0% | 44.0% |
| 2008 | 27.0% | 29.0% | 41.0% |
| CST Earth Science Test | |||
| 2010 | 21.0% | 18.0% | 29.0% |
| 2009 | 20.0% | 15.0% | 23.0% |
| CST English-Language Arts Test | |||
| 2010 | 44.0% | 47.0% | 45.0% |
| 2009 | 37.0% | 44.0% | 44.0% |
| 2008 | 39.0% | 45.0% | 41.0% |
| CST Geometry Test | |||
| 2010 | 7.0% | 8.0% | 14.0% |
| 2009 | 7.0% | 11.0% | 14.0% |
| 2008 | 3.0% | 5.0% | 12.0% |
| CST Science Test | |||
| 2010 | 61.0% | 52.0% | 46.0% |
| 2009 | 54.0% | 51.0% | 44.0% |
| 2008 | 47.0% | 46.0% | 40.0% |
| CST World History Test | |||
| 2010 | 41.0% | 39.0% | 42.0% |
| 2009 | 39.0% | 41.0% | 38.0% |
| 2008 | 29.0% | 32.0% | 33.0% |
Grade 11 - % of students at or above proficiency
| School | District | State | |
|---|---|---|---|
| CST Algebra I Test | |||
| 2010 | 22.0% | 12.0% | 8.0% |
| 2009 | 10.0% | 6.0% | 8.0% |
| 2008 | 3.0% | 5.0% | 5.0% |
| CST Algebra II Test | |||
| 2010 | 10.0% | 8.0% | 14.0% |
| 2009 | 6.0% | 4.0% | 12.0% |
| 2008 | 5.0% | 6.0% | 11.0% |
| CST Biology Test | |||
| 2010 | 65.0% | 63.0% | 46.0% |
| 2009 | 42.0% | 49.0% | 41.0% |
| 2008 | 52.0% | 50.0% | 39.0% |
| CST Chemistry Test | |||
| 2010 | 23.0% | 23.0% | 30.0% |
| 2009 | 16.0% | 17.0% | 27.0% |
| 2008 | 7.0% | 11.0% | 25.0% |
| CST Earth Science Test | |||
| 2010 | 36.0% | 29.0% | 32.0% |
| CST English-Language Arts Test | |||
| 2010 | 39.0% | 44.0% | 42.0% |
| 2009 | 38.0% | 43.0% | 40.0% |
| 2008 | 42.0% | 39.0% | 37.0% |
| CST Geometry Test | |||
| 2010 | 6.0% | 5.0% | 6.0% |
| 2009 | 4.0% | 7.0% | 7.0% |
| 2008 | 5.0% | 5.0% | 6.0% |
| CST Physics Test | |||
| 2010 | 86.0% | 81.0% | 53.0% |
| 2009 | 36.0% | 50.0% | 50.0% |
| 2008 | 60.0% | 60.0% | 47.0% |
| CST Summative High School Math Test | |||
| 2010 | 58.0% | 35.0% | 50.0% |
| 2009 | 31.0% | 31.0% | 47.0% |
| 2008 | 44.0% | 34.0% | 43.0% |
| CST U.S. History Test | |||
| 2010 | 51.0% | 47.0% | 45.0% |
| 2009 | 49.0% | 45.0% | 44.0% |
| 2008 | 47.0% | 37.0% | 38.0% |
End of Course - % of students at or above proficiency
| School | District | State | |
|---|---|---|---|
| CST Algebra I Test | |||
| 2010 | 23.0% | 21.0% | 31.0% |
| 2009 | 12.0% | 15.0% | 28.0% |
| 2008 | 8.0% | 11.0% | 25.0% |
| CST Algebra II Test | |||
| 2010 | 19.0% | 17.0% | 31.0% |
| 2009 | 15.0% | 11.0% | 28.0% |
| 2008 | 9.0% | 13.0% | 27.0% |
| CST Biology Test | |||
| 2010 | 54.0% | 51.0% | 46.0% |
| 2009 | 48.0% | 46.0% | 42.0% |
| 2008 | 44.0% | 48.0% | 42.0% |
| CST Chemistry Test | |||
| 2010 | 28.0% | 33.0% | 38.0% |
| 2009 | 23.0% | 28.0% | 36.0% |
| 2008 | 10.0% | 18.0% | 32.0% |
| CST Earth Science Test | |||
| 2010 | 40.0% | 37.0% | 33.0% |
| 2009 | 24.0% | 25.0% | 28.0% |
| 2008 | 33.0% | 35.0% | 28.0% |
| CST Geometry Test | |||
| 2010 | 14.0% | 14.0% | 27.0% |
| 2009 | 13.0% | 17.0% | 26.0% |
| 2008 | 13.0% | 13.0% | 24.0% |
| CST Physics Test | |||
| 2010 | 88.0% | 83.0% | 49.0% |
| 2009 | 36.0% | 52.0% | 46.0% |
| 2008 | 60.0% | 62.0% | 43.0% |
| CST Summative High School Math Test | |||
| 2010 | 60.0% | 40.0% | 54.0% |
| 2009 | 31.0% | 34.0% | 50.0% |
| 2008 | 46.0% | 36.0% | 47.0% |
| CST World History Test | |||
| 2010 | 41.0% | 39.0% | 41.0% |
| 2009 | 37.0% | 39.0% | 38.0% |
| 2008 | 28.0% | 30.0% | 33.0% |
Source: CA Department of Education 2009-2010
School Map and Similar Schools Nearby
Click to Activate Map of Nearby School Campuses
Private
Public
This School
Similar Schools Nearby
| Liberty High School 9-12 | 2,122 Students | 2.6 miles away | Not Yet Rated | |
| Deer Valley High School 9-12 | 2,692 Students | 3.4 miles away | ![]() 3 out of 5 | |
| Heritage High School 9-12 | 2,114 Students | 3.6 miles away | Not Yet Rated | |
| Antioch High School 9-12 | 2,289 Students | 6.1 miles away | Not Yet Rated | |
| Hillview Junior High School 6-8 | 1,090 Students | 9.6 miles away | ![]() 3 out of 5 | |
| Pittsburg High School 9-12 | 2,391 Students | 9.8 miles away | ![]() 4 out of 5 | |
| Central Junior High School 6-8 | 1,099 Students | 11.2 miles away | ![]() 4.5 out of 5 | |
| Rio Vista High School 9-12 | 321 Students | 12.8 miles away | Not Yet Rated | |
| Clayton Valley High School 9-12 | 1,868 Students | 13.9 miles away | Not Yet Rated | |
| Concord High School 9-12 | 1,591 Students | 14.8 miles away | Not Yet Rated | |
Compare This School To Nearby Schools ->
School Community Forum

Join a discussion about Freedom High School and talk to others in the community including students, parents, teachers, and administrators.
Popular Discussion Topics
- Admissions and Registration Questions (e.g. Dress Code and Discipline Policy)
- School Calendar and Upcoming Events (e.g. Graduation)
- After School Programs, Extracurricular Activities, and Athletics (e.g. Football)
- News and Announcements (e.g. Yearbook and Class Supply List Details)
- Graduate and Alumni Events (e.g. Organizing Class Reunions)
Navigation
Can't Find What You Are Looking For?
Rankings
Nearby Cities
Sponsored Links
K-12 Articles
Parent and Family Involvement in School
When visiting my grandson's school, I often hear administrators and teachers complaining that not...
Helping Your Child Leave the Nest
It's all come down to this: Eighteen years of good times and bad, and now your baby bird is ready...
All About Backpacks
Your child riffles through his backpack to find homework assignments, his MP3 player, lunch money...


