Herndon Elementary School
Rating
Not Available
Not Available

No Reviews Yet
Find Old Friends From Herndon Elementary School
Use the form below to search for alumni from Herndon Elementary School.
School Description
School Summary and Highlights
- Enrolls 834 preschool and elementary school students from grades PK-6
- Ranks 977th out of 1,149 elementary schools in VA.
School Operational Details
- Magnet School
School District Details
- Fairfax County Public Schools District
- Per-Pupil Spending: $13,275
- Graduation Rate: 86.0%
- Dropout Rate: 2.2%
- Students Per Teacher: 19.7
- Enrolled Students: 171,901
Faculty Details and Student Enrollment
Students and Faculty
- Total Students Enrolled: 834
- Total Full Time "Equivalent" Teachers: 46.0
- Average Student-To-Teacher Ratio: 18.1
Students Gender Breakdown
- Males: 366 (43.9%)
- Females: 396 (47.5%)
Free Lunch Student Eligibility Breakdown
- Eligible for Reduced Lunch: 51 (6.1%)
- Eligible for Free Lunch: 271 (32.5%)
- Eligible for Either Reduced or Free Lunch: 322 (38.6%)
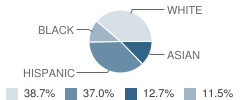
Student Enrollment Distribution by Race / Ethnicity
| Number | Percent | |
|---|---|---|
| American Indian | - | - |
| Black | 88 | 10.6% |
| Asian | 97 | 11.6% |
| Hispanic | 282 | 33.8% |
| White | 295 | 35.4% |
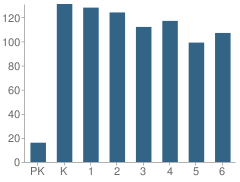
Number of Students Per Grade
| Number | Percent | |
|---|---|---|
| Pre-Kindergarten | 16 | 1.9% |
| Kindergarten | 131 | 15.7% |
| 1st Grade | 128 | 15.3% |
| 2nd Grade | 124 | 14.9% |
| 3rd Grade | 112 | 13.4% |
| 4th Grade | 117 | 14.0% |
| 5th Grade | 99 | 11.9% |
| 6th Grade | 107 | 12.8% |
Source: VA Department of Education, Source: NCES 2009-2010
School Ratings and Reviews
Be The First To Review Herndon Elementary School!
School Map and Similar Schools Nearby
Click to Activate Map of Nearby School Campuses
Private
Public
This School
Similar Schools Nearby
| Armstrong Elementary School PK-6 | 487 Students | 1.0 miles away | Not Yet Rated | |
| Clearview Elementary School PK-6 | 584 Students | 1.0 miles away | Not Yet Rated | |
| Dranesville Elementary School PK-6 | 622 Students | 1.6 miles away | Not Yet Rated | |
| Forest Grove Elementary School PK-5 | 563 Students | 1.7 miles away | Not Yet Rated | |
| Lake Anne Elementary School PK-6 | 627 Students | 1.7 miles away | Not Yet Rated | |
| Sully Elementary School PK-5 | 414 Students | 1.9 miles away | Not Yet Rated | |
| Hutchison Elementary School PK-6 | 710 Students | 2.0 miles away | Not Yet Rated | |
| Aldrin Elementary School PK-6 | 591 Students | 2.0 miles away | Not Yet Rated | |
| Forestdale Elementary School PK-6 | 542 Students | 2.6 miles away | Not Yet Rated | |
| Sterling Elementary School PK-5 | 533 Students | 2.7 miles away | Not Yet Rated | |
Compare This School To Nearby Schools ->
School Community Forum

Join a discussion about Herndon Elementary School and talk to others in the community including students, parents, teachers, and administrators.
Popular Discussion Topics
- Admissions and Registration Questions (e.g. Dress Code and Discipline Policy)
- School Calendar and Upcoming Events (e.g. Graduation)
- After School Programs, Extracurricular Activities, and Athletics (e.g. Football)
- News and Announcements (e.g. Yearbook and Class Supply List Details)
- Graduate and Alumni Events (e.g. Organizing Class Reunions)
Navigation
Can't Find What You Are Looking For?
Rankings
Nearby Cities
Sponsored Links
K-12 Articles

Everyone Loves Going to the Doctor and Dentist
Going to the doctor or dentist can be traumatic for children of all ages. Many adults do not...
Going to the doctor or dentist can be traumatic for children of all ages. Many adults do not...

Se Hablan Otras Idiomas?
In the late 1990s, the Salem-Keizer school district in Oregon began requiring every student in its...
In the late 1990s, the Salem-Keizer school district in Oregon began requiring every student in its...

Teaching Your Kids About Respect, Values and Violence
These days it seems that every newscast reports at least once incident of violence. As parents, we...
These days it seems that every newscast reports at least once incident of violence. As parents, we...