Thomas Hunter Middle School
Rating
Not Available
Not Available

No Reviews Yet
Find Old Friends From Thomas Hunter Middle School
Use the form below to search for alumni from Thomas Hunter Middle School.
School Description
School Summary and Highlights
- Enrolls 371 elementary and middle school students from grades 5-8
- Ranks 295th out of 419 middle schools in VA.
Additional Contact Information
- Mailing Address: PO Box 339, Mathews, VA 23109
School District Details
- Mathews County Public Schools District
- Per-Pupil Spending: $9,275
- Graduation Rate: 86.1%
- Dropout Rate: 1.3%
- Students Per Teacher: 18.2
- Enrolled Students: 1,239
Faculty Details and Student Enrollment
Students and Faculty
- Total Students Enrolled: 371
- Total Full Time "Equivalent" Teachers: 19.1
- Average Student-To-Teacher Ratio: 19.4
Students Gender Breakdown
- Males: 197 (53.1%)
- Females: 169 (45.6%)
Free Lunch Student Eligibility Breakdown
- Eligible for Reduced Lunch: 18 (4.9%)
- Eligible for Free Lunch: 95 (25.6%)
- Eligible for Either Reduced or Free Lunch: 113 (30.5%)
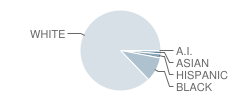
Student Enrollment Distribution by Race / Ethnicity
| Number | Percent | |
|---|---|---|
| American Indian | 1 | 0.3% |
| Black | 36 | 9.7% |
| Asian | 4 | 1.1% |
| Hispanic | 6 | 1.6% |
| White | 319 | 86.0% |
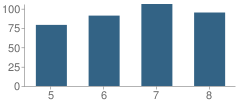
Number of Students Per Grade
| Number | Percent | |
|---|---|---|
| 5th Grade | 79 | 21.3% |
| 6th Grade | 91 | 24.5% |
| 7th Grade | 106 | 28.6% |
| 8th Grade | 95 | 25.6% |
Source: VA Department of Education, Source: NCES 2009-2010
School Ratings and Reviews
Be The First To Review Thomas Hunter Middle School!
School Map and Similar Schools Nearby
Click to Activate Map of Nearby School Campuses
Private
Public
This School
Similar Schools Nearby
| Page Middle School 6-8 | 571 Students | 12.1 miles away |  5 out of 5 | |
| Peasley Middle School 6-8 | 767 Students | 15.5 miles away |  4.5 out of 5 | |
Compare This School To Nearby Schools ->
School Community Forum

Join a discussion about Thomas Hunter Middle School and talk to others in the community including students, parents, teachers, and administrators.
Popular Discussion Topics
- Admissions and Registration Questions (e.g. Dress Code and Discipline Policy)
- School Calendar and Upcoming Events (e.g. Graduation)
- After School Programs, Extracurricular Activities, and Athletics (e.g. Football)
- News and Announcements (e.g. Yearbook and Class Supply List Details)
- Graduate and Alumni Events (e.g. Organizing Class Reunions)
Navigation
Can't Find What You Are Looking For?
Rankings
Sponsored Links
K-12 Articles

Helping Young Children with Printing and Cursive Writing
Is your child experiencing difficulty printing or writing? Is he unable to print or write legibly,...
Is your child experiencing difficulty printing or writing? Is he unable to print or write legibly,...

Parent and Family Involvement in School
When visiting my grandson’s school, I often hear administrators and teachers complaining that not...
When visiting my grandson’s school, I often hear administrators and teachers complaining that not...

School Violence: Can It Be Stopped
It’s a fact that violence in schools is prevalent in today’s society. We hear of school shootings,...
It’s a fact that violence in schools is prevalent in today’s society. We hear of school shootings,...