Hamilton Middle School
Rating
Not Available
Not Available

5 out of 5 | 1 Review
Find Old Friends From Hamilton Middle School
Use the form below to search for alumni from Hamilton Middle School.
School Description
School Summary and Highlights
- Enrolls 1,106 middle school students from grades 6-8
- Ranks 1708th out of 2,050 middle schools in CA.
- 2010 Overall School AYP Met Status: No
Additional Contact Information
- Mailing Address: 1060 East 70th St., Long Beach, CA 90805
School Operational Details
- Title I EligibleAll students of this school are eligible for participation in authorized programs.
School District Details
- Long Beach Unified School District
- Per-Pupil Spending: $9,646
- Graduation Rate: 65.5%
- Dropout Rate: 4.1%
- Students Per Teacher: 22.0
- Enrolled Students: 86,089
Faculty Details and Student Enrollment
Students and Faculty
- Total Students Enrolled: 1,106
- Total Full Time "Equivalent" Teachers: 42.0
- Average Student-To-Teacher Ratio: 26.3
Students Gender Breakdown
- Males: 562 (50.8%)
- Females: 544 (49.2%)
Free Lunch Student Eligibility Breakdown
- Eligible for Reduced Lunch: 128 (11.6%)
- Eligible for Free Lunch: 880 (79.6%)
- Eligible for Either Reduced or Free Lunch: 1,008 (91.1%)
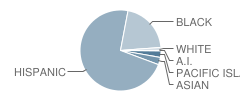
Student Enrollment Distribution by Race / Ethnicity
| Number | Percent | |
|---|---|---|
| American Indian | 3 | 0.3% |
| Black | 229 | 20.7% |
| Asian | 33 | 3.0% |
| Hispanic | 793 | 71.7% |
| White | 14 | 1.3% |
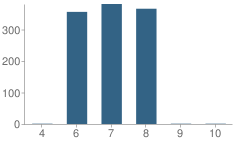
Number of Students Per Grade
| Number | Percent | |
|---|---|---|
| 4th Grade | 1 | 0.09% |
| 6th Grade | 356 | 32.2% |
| 7th Grade | 381 | 34.4% |
| 8th Grade | 366 | 33.1% |
| 9th Grade | 1 | 0.09% |
| 10th Grade | 1 | 0.09% |
Teacher Education Background (2009)
Percent With Ph.D.
School:
1.8%
District:
4.9%
Percent With Master's Degree
School:
23.6%
District:
28.5%
Percent With Bachelor's Degree
School:
10.9%
District:
70.4%
Teacher Credentials & Experience (2009)
Percent of Teachers With Credentials: 97.7%
Number of Certificated Staff: 55.0
Average Number of Years of Teacher Experience: 8.7
Average Age
School:
39.3
District:
44.2
Source: CA Department of Education, Source: NCES 2009-2010
School Ratings and Reviews
Overall Rating: 5

5 out of 5 | 1 Review
The Overall Rating is the school's average rating from parents, students, school faculty and staff. The highest rating is five apples and the lowest is one apple.
Share Your Review About This School
1 review for Hamilton Middle School
- Reviewed by Teacher on January 12, 2010
- Rating:
 (5 / 5) Flag as inappropriate
 - good school
School Map and Similar Schools Nearby
Click to Activate Map of Nearby School Campuses
Private
Public
This School
Similar Schools Nearby
| Leona Jackson School 4-8 | 771 Students | 0.5 miles away | Not Yet Rated | |
| Frank J. Zamboni School 6-8 | 930 Students | 0.6 miles away | Not Yet Rated | |
| Whaley Middle School 6-8 | 950 Students | 1.6 miles away |  4 out of 5 | |
| Alondra Middle School 6-8 | 933 Students | 1.7 miles away | Not Yet Rated | - |
| Paramount Park Middle School 6-8 | 826 Students | 1.7 miles away | Not Yet Rated | - |
| Roosevelt Middle School 6-8 | 1,153 Students | 1.8 miles away |  5 out of 5 | |
| Colin L. Powell Academy for Success KG-8 | 1,159 Students | 1.8 miles away | Not Yet Rated | |
| Lindbergh Middle School 6-8 | 869 Students | 1.9 miles away | Not Yet Rated | |
| Hollydale Elementary School KG-8 | 1,127 Students | 2.5 miles away |  4.5 out of 5 | |
| Albert Baxter Elementary School KG-6 | 554 Students | 2.5 miles away | Not Yet Rated | |
Compare This School To Nearby Schools ->
School Community Forum

Join a discussion about Hamilton Middle School and talk to others in the community including students, parents, teachers, and administrators.
Popular Discussion Topics
- Admissions and Registration Questions (e.g. Dress Code and Discipline Policy)
- School Calendar and Upcoming Events (e.g. Graduation)
- After School Programs, Extracurricular Activities, and Athletics (e.g. Football)
- News and Announcements (e.g. Yearbook and Class Supply List Details)
- Graduate and Alumni Events (e.g. Organizing Class Reunions)
Navigation
Can't Find What You Are Looking For?
Rankings
Nearby Cities
Sponsored Links
K-12 Articles

Simple Math ... a Simple Gift
Math affects every aspect of our lives-from balancing the checkbook to estimating the amount of...
Math affects every aspect of our lives-from balancing the checkbook to estimating the amount of...

The Most Used Form of Communication
Writing has, quite surprisingly, become more and more important in today’s electronic society....
Writing has, quite surprisingly, become more and more important in today’s electronic society....

Transform Your Middle School Slacker into a Scholar
All children need motivation to learn. Have your child’s grades decreased since he started middle...
All children need motivation to learn. Have your child’s grades decreased since he started middle...