Atkins Elementary School
Rating
Not Available
Not Available

No Reviews Yet
Find Old Friends From Atkins Elementary School
Use the form below to search for alumni from Atkins Elementary School.
School Description
School Summary and Highlights
- Enrolls 211 preschool and elementary school students from grades PK-5
- Ranks 941st out of 1,149 elementary schools in VA.
School Operational Details
- Title I Eligible
School District Details
- Smyth County Public Schools District
- Per-Pupil Spending: $9,279
- Graduation Rate: 73.6%
- Dropout Rate: 1.1%
- Students Per Teacher: 21.0
- Enrolled Students: 4,996
Faculty Details and Student Enrollment
Students and Faculty
- Total Students Enrolled: 211
- Total Full Time "Equivalent" Teachers: 9.4
- Average Student-To-Teacher Ratio: 22.5
Students Gender Breakdown
- Males: 116 (55.0%)
- Females: 95 (45.0%)
Free Lunch Student Eligibility Breakdown
- Eligible for Reduced Lunch: 23 (10.9%)
- Eligible for Free Lunch: 108 (51.2%)
- Eligible for Either Reduced or Free Lunch: 131 (62.1%)
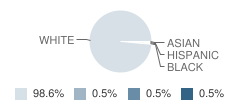
Student Enrollment Distribution by Race / Ethnicity
| Number | Percent | |
|---|---|---|
| American Indian | - | - |
| Black | 1 | 0.5% |
| Asian | 1 | 0.5% |
| Hispanic | 1 | 0.5% |
| White | 208 | 98.6% |
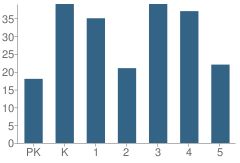
Number of Students Per Grade
| Number | Percent | |
|---|---|---|
| Pre-Kindergarten | 18 | 8.5% |
| Kindergarten | 39 | 18.5% |
| 1st Grade | 35 | 16.6% |
| 2nd Grade | 21 | 10.0% |
| 3rd Grade | 39 | 18.5% |
| 4th Grade | 37 | 17.5% |
| 5th Grade | 22 | 10.4% |
Source: VA Department of Education, Source: NCES 2009-2010
School Ratings and Reviews
Be The First To Review Atkins Elementary School!
School Map and Similar Schools Nearby
Click to Activate Map of Nearby School Campuses
Private
Public
This School
Similar Schools Nearby
| Marion Primary School PK-2 | 470 Students | 5.6 miles away | Not Yet Rated | - |
| Marion Int. School 3-5 | 430 Students | 5.9 miles away |  4 out of 5 | |
| Sugar Grove Comb. School PK-8 | 201 Students | 6.7 miles away | Not Yet Rated | |
| Rich Valley Elementary School PK-5 | 195 Students | 12.8 miles away |  5 out of 5 | |
| Speedwell Elementary School PK-5 | 162 Students | 13.4 miles away | Not Yet Rated | |
| Chilhowie Elementary School PK-5 | 634 Students | 16.1 miles away | 5 out of 5 | |
| Spiller Primary School PK-5 | 716 Students | 18.6 miles away | Not Yet Rated | |
| Sheffey Elementary School PK-5 | 297 Students | 18.7 miles away | 5 out of 5 | |
| North Tazewell Elementary School PK-5 | 318 Students | 18.9 miles away | 5 out of 5 | |
| Saltville Elementary School PK-5 | 286 Students | 19.1 miles away | Not Yet Rated | |
Compare This School To Nearby Schools ->
School Community Forum

Join a discussion about Atkins Elementary School and talk to others in the community including students, parents, teachers, and administrators.
Popular Discussion Topics
- Admissions and Registration Questions (e.g. Dress Code and Discipline Policy)
- School Calendar and Upcoming Events (e.g. Graduation)
- After School Programs, Extracurricular Activities, and Athletics (e.g. Football)
- News and Announcements (e.g. Yearbook and Class Supply List Details)
- Graduate and Alumni Events (e.g. Organizing Class Reunions)
Navigation
Can't Find What You Are Looking For?
Rankings
Nearby Cities
Sponsored Links
K-12 Articles

School Violence: Can It Be Stopped
It's a fact that violence in schools is prevalent in today's society. We hear of school shootings,...
It's a fact that violence in schools is prevalent in today's society. We hear of school shootings,...

Just a Harmless Vanilla Bean?
Some of the greatest, most used, and most profitable breakthroughs in science have not been made by...
Some of the greatest, most used, and most profitable breakthroughs in science have not been made by...

A Cheat Sheet on Cheating
Senior projects are coming due and finals are coming up. Spring has sprung, and with spring comes...
Senior projects are coming due and finals are coming up. Spring has sprung, and with spring comes...