Mount Vernon Elementary School
Rating
Not Available
Not Available

No Reviews Yet
Find Old Friends From Mount Vernon Elementary School
Use the form below to search for alumni from Mount Vernon Elementary School.
School Description
School Summary and Highlights
- Enrolls 71 elementary school students from grades KG-5
- Ranks 433rd out of 459 elementary schools in WV.
Additional Contact Information
- Mailing Address: Rr 1 Box 374-C, Flemington, WV 26347
School Operational Details
- Title I EligibleAll students of this school are eligible for participation in authorized programs.
School District Details
- Barbour County School District
- Per-Pupil Spending: $8,983
- Graduation Rate: 74.3%
- Dropout Rate: 5.2%
- Students Per Teacher: 14.3
- Enrolled Students: 2,478
Faculty Details and Student Enrollment
Students and Faculty
- Total Students Enrolled: 71
- Total Full Time "Equivalent" Teachers: 6.7
- Average Student-To-Teacher Ratio: 10.7
Students Gender Breakdown
- Males: 38 (53.5%)
- Females: 33 (46.5%)
Free Lunch Student Eligibility Breakdown
- Eligible for Reduced Lunch: 12 (16.9%)
- Eligible for Free Lunch: 47 (66.2%)
- Eligible for Either Reduced or Free Lunch: 59 (83.1%)
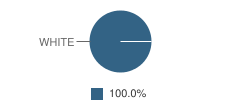
Student Enrollment Distribution by Race / Ethnicity
| Number | Percent | |
|---|---|---|
| American Indian | - | - |
| Black | - | - |
| Asian | - | - |
| Hispanic | - | - |
| White | 70 | 98.6% |
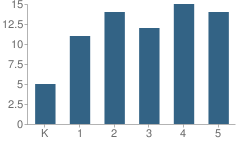
Number of Students Per Grade
| Number | Percent | |
|---|---|---|
| Kindergarten | 5 | 7.0% |
| 1st Grade | 11 | 15.5% |
| 2nd Grade | 14 | 19.7% |
| 3rd Grade | 12 | 16.9% |
| 4th Grade | 15 | 21.1% |
| 5th Grade | 14 | 19.7% |
Source: WV Department of Education, Source: NCES 2009-2010
School Ratings and Reviews
Be The First To Review Mount Vernon Elementary School!
School Map and Similar Schools Nearby
Click to Activate Map of Nearby School Campuses
Private
Public
This School
Similar Schools Nearby
| Flemington Elementary School PK-4 | 149 Students | 3.4 miles away | Not Yet Rated | |
| Philippi Elementary School PK-5 | 416 Students | 6.6 miles away | Not Yet Rated | |
| Hepzibah Elementary School PK-4 | 272 Students | 7.0 miles away | Not Yet Rated | |
| Simpson Elementary School PK-5 | 356 Students | 7.5 miles away | Not Yet Rated | |
| Johnson Elementary School PK-5 | 645 Students | 8.0 miles away | Not Yet Rated | |
| Taylor County Middle School 5-8 | 711 Students | 9.0 miles away | Not Yet Rated | |
| Norwood Elementary School PK-5 | 344 Students | 9.5 miles away |  4 out of 5 | |
| Nutter Fort Intermediate School 3-5 | 531 Students | 10.1 miles away |  3 out of 5 | |
| Anna Jarvis Elementary School PK-4 | 623 Students | 10.7 miles away | Not Yet Rated | |
| Philip Barbour High School PK-12 | 806 Students | 11.1 miles away | Not Yet Rated | |
Compare This School To Nearby Schools ->
Navigation
Can't Find What You Are Looking For?
Rankings
Nearby Cities
Sponsored Links
K-12 Articles

Everyone Loves Going to the Doctor and Dentist
Going to the doctor or dentist can be traumatic for children of all ages. Many adults do not...
Going to the doctor or dentist can be traumatic for children of all ages. Many adults do not...

Transform Your Middle School Slacker into a Scholar
All children need motivation to learn. Have your child’s grades decreased since he started middle...
All children need motivation to learn. Have your child’s grades decreased since he started middle...

Nothing New Under the Sun
“I had to go through the same thing when I went to school.” Every parent has uttered this phrase,...
“I had to go through the same thing when I went to school.” Every parent has uttered this phrase,...