Glen Alta Elementary School
Rating
Not Available
Not Available

5 out of 5 | 1 Review
Find Old Friends From Glen Alta Elementary School
Use the form below to search for alumni from Glen Alta Elementary School.
School Description
School Summary and Highlights
- Enrolls 218 elementary school students from grades KG-6
- Ranks 4107th out of 5,423 elementary schools in CA.
- 2010 Overall School AYP Met Status: No
Additional Contact Information
- Mailing Address: 3410 Sierra St., Los Angeles, CA 90031
School Operational Details
- Title I EligibleAll students of this school are eligible for participation in authorized programs.
School District Details
- Los Angeles Unified School District
- Per-Pupil Spending: $11,357
- Graduation Rate: 48.8%
- Dropout Rate: 6.8%
- Students Per Teacher: 21.3
- Enrolled Students: 667,870
Faculty Details and Student Enrollment
Students and Faculty
- Total Students Enrolled: 218
- Total Full Time "Equivalent" Teachers: 12.0
- Average Student-To-Teacher Ratio: 18.2
Students Gender Breakdown
- Males: 104 (47.7%)
- Females: 114 (52.3%)
Free Lunch Student Eligibility Breakdown
- Eligible for Reduced Lunch: 12 (5.5%)
- Eligible for Free Lunch: 192 (88.1%)
- Eligible for Either Reduced or Free Lunch: 204 (93.6%)
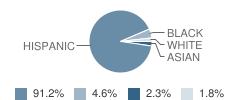
Student Enrollment Distribution by Race / Ethnicity
| Number | Percent | |
|---|---|---|
| American Indian | - | - |
| Black | 10 | 4.6% |
| Asian | 5 | 2.3% |
| Hispanic | 198 | 90.8% |
| White | 4 | 1.8% |
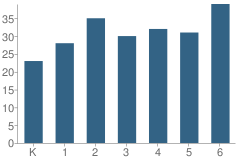
Number of Students Per Grade
| Number | Percent | |
|---|---|---|
| Kindergarten | 23 | 10.6% |
| 1st Grade | 28 | 12.8% |
| 2nd Grade | 35 | 16.1% |
| 3rd Grade | 30 | 13.8% |
| 4th Grade | 32 | 14.7% |
| 5th Grade | 31 | 14.2% |
| 6th Grade | 39 | 17.9% |
Teacher Education Background (2009)
Percent With Ph.D.
School:
5.9%
District:
3.7%
Percent With Master's Degree
School:
17.6%
District:
26.9%
Percent With Bachelor's Degree
School:
5.9%
District:
31.9%
Teacher Credentials & Experience (2009)
Percent of Teachers With Credentials: 100.0%
Number of Certificated Staff: 17.0
Average Number of Years of Teacher Experience: 13.7
Average Age
School:
46.4
District:
46.7
Source: CA Department of Education, Source: NCES 2009-2010
School Ratings and Reviews
Overall Rating: 5

5 out of 5 | 1 Review
The Overall Rating is the school's average rating from parents, students, school faculty and staff. The highest rating is five apples and the lowest is one apple.
Share Your Review About This School
1 review for Glen Alta Elementary School
- Reviewed by Student on April 09, 2010
- Rating:
 (5 / 5) Flag as inappropriate
 - u are cool
School Map and Similar Schools Nearby
Click to Activate Map of Nearby School Campuses
Private
Public
This School
Similar Schools Nearby
| Latona Avenue Elementary School KG-5 | 293 Students | 0.5 miles away | Not Yet Rated | |
| Huntington Drive Elementary School KG-6 | 548 Students | 0.5 miles away |  5 out of 5 | |
| Hillside Elementary School KG-5 | 427 Students | 0.7 miles away | Not Yet Rated | |
| Gates Street Elementary School KG-5 | 740 Students | 0.9 miles away | Not Yet Rated | |
| Loreto Street Elementary School KG-5 | 466 Students | 1.0 miles away | 5 out of 5 | |
| Multnomah Street Elementary School KG-5 | 519 Students | 1.2 miles away | Not Yet Rated | |
| Farmdale Elementary School KG-5 | 598 Students | 1.3 miles away | 5 out of 5 | |
| Griffin Avenue Elementary School KG-5 | 599 Students | 1.3 miles away | Not Yet Rated | |
| El Sereno Elementary School KG-6 | 550 Students | 1.3 miles away | Not Yet Rated | |
| Bushnell Way Elementary School KG-5 | 415 Students | 1.4 miles away |  4 out of 5 | |
Compare This School To Nearby Schools ->
School Community Forum

Join a discussion about Glen Alta Elementary School and talk to others in the community including students, parents, teachers, and administrators.
Popular Discussion Topics
- Admissions and Registration Questions (e.g. Dress Code and Discipline Policy)
- School Calendar and Upcoming Events (e.g. Graduation)
- After School Programs, Extracurricular Activities, and Athletics (e.g. Football)
- News and Announcements (e.g. Yearbook and Class Supply List Details)
- Graduate and Alumni Events (e.g. Organizing Class Reunions)
Navigation
Can't Find What You Are Looking For?
Rankings
Nearby Cities
Sponsored Links
K-12 Articles

Helping Your Child Leave the Nest
It’s all come down to this: Eighteen years of good times and bad, and now your baby bird is ready...
It’s all come down to this: Eighteen years of good times and bad, and now your baby bird is ready...

Summer Safety Tips to Keep Kids Safe
It won’t be long until kids run from the school, shrieking in delight because they’re free for the...
It won’t be long until kids run from the school, shrieking in delight because they’re free for the...

Your Child and School Corporal Punishment
Your child comes home at the end of the school day with a huge bruise on his upper arm. When you...
Your child comes home at the end of the school day with a huge bruise on his upper arm. When you...