Pio Pico Elementary School
1512 South Arlington Ave, Los Angeles, CA 90019 | (323) 733-8801
- Grades: KG-8
- Student Enrollment: 1,340
Rating
Not Available
Not Available

No Reviews Yet
Find Old Friends From Pio Pico Elementary School
Use the form below to search for alumni from Pio Pico Elementary School.
School Description
School Summary and Highlights
- Enrolls 1,340 elementary school students from grades KG-8
- Ranks 1733rd out of 2,050 middle schools in CA.
- 2010 Overall School AYP Met Status: No
Additional Contact Information
- Mailing Address: 1512 South Arlington Ave., Los Angeles, CA 90019
School Operational Details
- Title I EligibleAll students of this school are eligible for participation in authorized programs.
School District Details
- Los Angeles Unified School District
- Per-Pupil Spending: $11,357
- Graduation Rate: 48.8%
- Dropout Rate: 6.8%
- Students Per Teacher: 21.3
- Enrolled Students: 667,870
Faculty Details and Student Enrollment
Students and Faculty
- Total Students Enrolled: 1,340
- Total Full Time "Equivalent" Teachers: 77.0
- Average Student-To-Teacher Ratio: 17.4
Students Gender Breakdown
- Males: 675 (50.4%)
- Females: 665 (49.6%)
Free Lunch Student Eligibility Breakdown
- Eligible for Reduced Lunch: 52 (3.9%)
- Eligible for Free Lunch: 1,285 (95.9%)
- Eligible for Either Reduced or Free Lunch: 1,337 (99.8%)
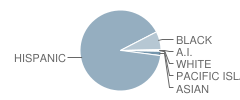
Student Enrollment Distribution by Race / Ethnicity
| Number | Percent | |
|---|---|---|
| American Indian | 1 | 0.07% |
| Black | 97 | 7.2% |
| Asian | 23 | 1.7% |
| Hispanic | 1,209 | 90.2% |
| White | 5 | 0.4% |
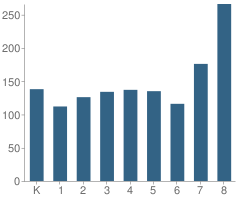
Number of Students Per Grade
| Number | Percent | |
|---|---|---|
| Kindergarten | 138 | 10.3% |
| 1st Grade | 112 | 8.4% |
| 2nd Grade | 126 | 9.4% |
| 3rd Grade | 134 | 10.0% |
| 4th Grade | 137 | 10.2% |
| 5th Grade | 135 | 10.1% |
| 6th Grade | 116 | 8.7% |
| 7th Grade | 176 | 13.1% |
| 8th Grade | 266 | 19.9% |
Teacher Education Background (2009)
Percent With Ph.D.
School:
2.0%
District:
3.7%
Percent With Master's Degree
School:
7.1%
District:
26.9%
Percent With Bachelor's Degree
School:
13.1%
District:
31.9%
Teacher Credentials & Experience (2009)
Percent of Teachers With Credentials: 98.9%
Number of Certificated Staff: 99.0
Average Number of Years of Teacher Experience: 10.3
Average Age
School:
41.6
District:
46.7
Source: CA Department of Education, Source: NCES 2009-2010
School Ratings and Reviews
Be The First To Review Pio Pico Elementary School!
School Map and Similar Schools Nearby
Click to Activate Map of Nearby School Campuses
Private
Public
This School
Similar Schools Nearby
| Arlington Heights Elementary School KG-5 | 688 Students | 0.5 miles away | Not Yet Rated | |
| Los Angeles Elementary School KG-5 | 803 Students | 0.7 miles away |  5 out of 5 | |
| Twenty-Fourth Street Elementary School KG-5 | 814 Students | 0.8 miles away | 5 out of 5 | |
| Queen Anne Place Elementary School KG-5 | 441 Students | 0.9 miles away | 5 out of 5 | |
| Hobart Boulevard Elementary School KG-5 | 965 Students | 0.9 miles away | Not Yet Rated | |
| Wilton Place Elementary School KG-5 | 957 Students | 1.0 miles away | 5 out of 5 | |
| Wilshire Park Elementary School KG-5 | 475 Students | 1.1 miles away | Not Yet Rated | |
| Alta Loma Elementary School KG-5 | 683 Students | 1.2 miles away | Not Yet Rated | |
| Mariposa-Nabi Primary Center School KG-2 | 240 Students | 1.2 miles away | Not Yet Rated | |
| Sixth Avenue Elementary School KG-5 | 814 Students | 1.3 miles away |  3.5 out of 5 | |
Compare This School To Nearby Schools ->
School Community Forum

Join a discussion about Pio Pico Elementary School and talk to others in the community including students, parents, teachers, and administrators.
Popular Discussion Topics
- Admissions and Registration Questions (e.g. Dress Code and Discipline Policy)
- School Calendar and Upcoming Events (e.g. Graduation)
- After School Programs, Extracurricular Activities, and Athletics (e.g. Football)
- News and Announcements (e.g. Yearbook and Class Supply List Details)
- Graduate and Alumni Events (e.g. Organizing Class Reunions)
Navigation
Can't Find What You Are Looking For?
Rankings
Sponsored Links
K-12 Articles

The Importance of Ninth Grade
Students who are entering ninth grade do not realize the importance of the critical decisions they...
Students who are entering ninth grade do not realize the importance of the critical decisions they...

Help Your High School Student Create an Impressive Resume
Time has flown. Your teen is in high school and has demonstrated an interest in obtaining a part...
Time has flown. Your teen is in high school and has demonstrated an interest in obtaining a part...

Making Sense of No Child Left Behind
The No Child Left Behind Act of 2001 has met with mixed results and mixed feelings. Some think it...
The No Child Left Behind Act of 2001 has met with mixed results and mixed feelings. Some think it...