Lorton Station Elementary School
Rating
Not Available
Not Available

No Reviews Yet
Find Old Friends From Lorton Station Elementary School
Use the form below to search for alumni from Lorton Station Elementary School.
School Description
School Summary and Highlights
- Enrolls 897 preschool and elementary school students from grades PK-6
- Ranks 534th out of 1,149 elementary schools in VA.
Additional Contact Information
- Mailing Address: 2499 Lewis Chapel Rd., Lorton, VA 22079
School District Details
- Fairfax County Public Schools District
- Per-Pupil Spending: $13,275
- Graduation Rate: 86.0%
- Dropout Rate: 2.2%
- Students Per Teacher: 19.7
- Enrolled Students: 171,901
Faculty Details and Student Enrollment
Students and Faculty
- Total Students Enrolled: 897
- Total Full Time "Equivalent" Teachers: 46.0
- Average Student-To-Teacher Ratio: 19.5
Students Gender Breakdown
- Males: 449 (50.1%)
- Females: 395 (44.0%)
Free Lunch Student Eligibility Breakdown
- Eligible for Reduced Lunch: 78 (8.7%)
- Eligible for Free Lunch: 273 (30.4%)
- Eligible for Either Reduced or Free Lunch: 351 (39.1%)
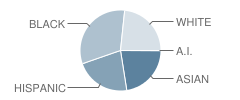
Student Enrollment Distribution by Race / Ethnicity
| Number | Percent | |
|---|---|---|
| American Indian | 1 | 0.1% |
| Black | 270 | 30.1% |
| Asian | 189 | 21.1% |
| Hispanic | 187 | 20.8% |
| White | 197 | 22.0% |
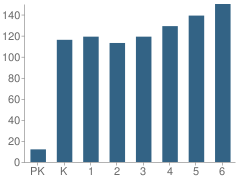
Number of Students Per Grade
| Number | Percent | |
|---|---|---|
| Pre-Kindergarten | 12 | 1.3% |
| Kindergarten | 116 | 12.9% |
| 1st Grade | 119 | 13.3% |
| 2nd Grade | 113 | 12.6% |
| 3rd Grade | 119 | 13.3% |
| 4th Grade | 129 | 14.4% |
| 5th Grade | 139 | 15.5% |
| 6th Grade | 150 | 16.7% |
Source: VA Department of Education, Source: NCES 2009-2010
School Ratings and Reviews
Be The First To Review Lorton Station Elementary School!
School Map and Similar Schools Nearby
Click to Activate Map of Nearby School Campuses
Private
Public
This School
Similar Schools Nearby
| Laurel Hill Elementary School PK-6 | 802 Students | 1.3 miles away | Not Yet Rated | |
| Gunston Elementary School PK-6 | 568 Students | 1.5 miles away |  2 out of 5 | |
| Saratoga Elementary School PK-6 | 742 Students | 2.1 miles away |  1 out of 5 | |
| Halley Elementary School PK-6 | 726 Students | 2.5 miles away | Not Yet Rated | |
| Newington Forest Elementary School PK-6 | 629 Students | 2.7 miles away |  5 out of 5 | |
| Occoquan Elementary School PK-5 | 569 Students | 3.1 miles away | 5 out of 5 | |
| Silverbrook Elementary School PK-6 | 774 Students | 3.3 miles away | Not Yet Rated | |
| Rockledge Elementary School PK-5 | 503 Students | 3.5 miles away | Not Yet Rated | |
| Belmont Elementary School PK-5 | 396 Students | 3.5 miles away | 5 out of 5 | |
| Island Creek Elementary School PK-6 | 782 Students | 3.7 miles away | 1 out of 5 | |
Compare This School To Nearby Schools ->
School Community Forum

Join a discussion about Lorton Station Elementary School and talk to others in the community including students, parents, teachers, and administrators.
Popular Discussion Topics
- Admissions and Registration Questions (e.g. Dress Code and Discipline Policy)
- School Calendar and Upcoming Events (e.g. Graduation)
- After School Programs, Extracurricular Activities, and Athletics (e.g. Football)
- News and Announcements (e.g. Yearbook and Class Supply List Details)
- Graduate and Alumni Events (e.g. Organizing Class Reunions)
Navigation
Can't Find What You Are Looking For?
Rankings
Nearby Cities
Sponsored Links
K-12 Articles

Keep Kids Learning All Summer
Early in the 20th century schools in urban districts operated all year `round. However, in rural...
Early in the 20th century schools in urban districts operated all year `round. However, in rural...

School Lunches ... Hot or Cold?
First there were four, now there are six, no one knows how many more there may be in the future....
First there were four, now there are six, no one knows how many more there may be in the future....

Teaching Children with Learning Disabilities to Make Friends
Children with learning disabilities often have trouble making and retaining friendships. Some kids...
Children with learning disabilities often have trouble making and retaining friendships. Some kids...