Canyon Springs High School
23100 Cougar Canyon Dr, Moreno Valley, CA 92557 | (951) 571-4760
- Grades: 9-12
- Student Enrollment: 2,584
Rating
Not Available
Not Available

5 out of 5 | 3 Reviews
Find Old Friends From Canyon Springs High School
Use the form below to search for alumni from Canyon Springs High School.
School Description
School Summary and Highlights
- Enrolls 2,584 high school students from grades 9-12
- Ranks 886th out of 1,197 high schools in CA.
- 2010 Overall School AYP Met Status: No
Additional Contact Information
- Mailing Address: 23100 Cougar Canyon Dr., Moreno Valley, CA 92557
School District Details
- Moreno Valley Unified School District
- Per-Pupil Spending: $8,394
- Graduation Rate: 60.5%
- Dropout Rate: 7.0%
- Students Per Teacher: 24.5
- Enrolled Students: 36,663
Faculty Details and Student Enrollment
Students and Faculty
- Total Students Enrolled: 2,584
- Total Full Time "Equivalent" Teachers: 101.8
- Average Student-To-Teacher Ratio: 25.4
Students Gender Breakdown
- Males: 1,369 (53.0%)
- Females: 1,215 (47.0%)
Free Lunch Student Eligibility Breakdown
- Eligible for Reduced Lunch: 364 (14.1%)
- Eligible for Free Lunch: 1,110 (43.0%)
- Eligible for Either Reduced or Free Lunch: 1,474 (57.0%)
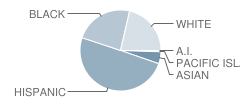
Student Enrollment Distribution by Race / Ethnicity
| Number | Percent | |
|---|---|---|
| American Indian | 6 | 0.2% |
| Black | 603 | 23.3% |
| Asian | 124 | 4.8% |
| Hispanic | 1,274 | 49.3% |
| White | 548 | 21.2% |
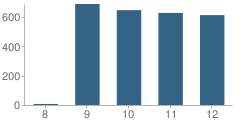
Number of Students Per Grade
| Number | Percent | |
|---|---|---|
| 8th Grade | 7 | 0.3% |
| 9th Grade | 689 | 26.7% |
| 10th Grade | 647 | 25.0% |
| 11th Grade | 628 | 24.3% |
| 12th Grade | 613 | 23.7% |
Graduates Information (2010)
Graduation Rate
School:
81.6%
District:
67.6%
State:
78.6%
Teacher Education Background (2009)
Percent With Master's Degree
School:
25.2%
District:
35.4%
Percent With Bachelor's Degree
School:
10.6%
District:
3.8%
Percent With Ph.D.
School:
2.4%
District:
6.3%
Teacher Credentials & Experience (2009)
Average Age
School:
44.8
District:
49.0
Average Number of Years of Teacher Experience: 14.9
Number of Certificated Staff: 123.0
Percent of Teachers With Credentials: 89.1%
Source: CA Department of Education, Source: NCES 2009-2010
School Ratings and Reviews
Overall Rating: 5

5 out of 5 | 3 Reviews
The Overall Rating is the school's average rating from parents, students, school faculty and staff. The highest rating is five apples and the lowest is one apple.
Share Your Review About This School
3 reviews for Canyon Springs High School
- Reviewed by Parent/Guardian on January 24, 2009
- Rating:
 (5 / 5) Flag as inappropriate
 - Now this is my school. And to be honest I love it. I might not feel very safe at times yet i still know that i am getting a great education. As for the teachers. they couldn't be any better if you paid them to. They are already the Best!
- Reviewed by Former Student on June 19, 2007
- Rating: (5 / 5) Flag as inappropriate
- I WENT TO CANYON SPRINGS ALMOST 10 YEARS AGO THE TEACHERS WERE AWESOME THEY DID ALL THEY COULD DO TO HELP ME GRADUATE. I HOPE THAT THE TEACHERS THAT WERE THERE WHEN I WENT ARE STILL THERE.
- Reviewed by Student on December 07, 2006
- Rating: (5 / 5) Flag as inappropriate
- i think this school is great with the exception of a few things like the lunch and some policies but still a great school.
School Map and Similar Schools Nearby
Click to Activate Map of Nearby School Campuses
Private
Public
This School
Similar Schools Nearby
| Moreno Valley High School 9-12 | 2,412 Students | 2.6 miles away | Not Yet Rated | |
| Valley View High School 9-12 | 2,815 Students | 4.6 miles away |  2.5 out of 5 | |
| John W. North High School 9-12 | 2,401 Students | 5.1 miles away |  5 out of 5 | |
| Vista Del Lago High School 9-12 | 2,583 Students | 5.1 miles away | 5 out of 5 | |
| Polytechnic High School 9-12 | 2,883 Students | 6.3 miles away | 5 out of 5 | |
| Martin Luther King Jr. High School 9-12 | 3,021 Students | 6.6 miles away | 5 out of 5 | |
| Riverside Virtual School KG-12 | 39 Students | 7.0 miles away | Not Yet Rated | - |
| Rancho Verde High School 9-12 | 3,453 Students | 7.6 miles away | 5 out of 5 | |
| Redlands High School 9-12 | 3,110 Students | 8.3 miles away | Not Yet Rated | |
| Colton High School 9-12 | 3,308 Students | 8.5 miles away |  4 out of 5 | |
Compare This School To Nearby Schools ->
School Community Forum

Join a discussion about Canyon Springs High School and talk to others in the community including students, parents, teachers, and administrators.
Popular Discussion Topics
- Admissions and Registration Questions (e.g. Dress Code and Discipline Policy)
- School Calendar and Upcoming Events (e.g. Graduation)
- After School Programs, Extracurricular Activities, and Athletics (e.g. Football)
- News and Announcements (e.g. Yearbook and Class Supply List Details)
- Graduate and Alumni Events (e.g. Organizing Class Reunions)
Navigation
Can't Find What You Are Looking For?
Rankings
Nearby Cities
Sponsored Links
K-12 Articles

Teaching Children with Learning Disabilities to Make Friends
Children with learning disabilities often have trouble making and retaining friendships. Some kids...
Children with learning disabilities often have trouble making and retaining friendships. Some kids...

Information on Cyberbullying
What is Cyberbullying? Cyberbullying is a new form of harassment, emotional abuse,...
What is Cyberbullying? Cyberbullying is a new form of harassment, emotional abuse,...

Teaching Children a Love of History
Parents and grandparents are responsible for teaching children a love of history. To begin, relate...
Parents and grandparents are responsible for teaching children a love of history. To begin, relate...