Polytechnic High School

5 out of 5 | 2 Reviews
Find Old Friends From Polytechnic High School
Use the form below to search for alumni from Polytechnic High School.
School Description
School Summary and Highlights
- Enrolls 2,883 high school students from grades 9-12
- Ranks 607th out of 1,197 high schools in CA.
- 2010 Overall School AYP Met Status: Yes
Additional Contact Information
- Mailing Address: 5450 Victoria Ave., Riverside, CA 92506
School District Details
- Riverside Unified School District
- Per-Pupil Spending: $8,268
- Graduation Rate: 66.6%
- Dropout Rate: 3.4%
- Students Per Teacher: 23.2
- Enrolled Students: 42,501
Faculty Details and Student Enrollment
Students and Faculty
- Total Students Enrolled: 2,883
- Total Full Time "Equivalent" Teachers: 109.0
- Average Student-To-Teacher Ratio: 26.5
Students Gender Breakdown
- Males: 1,438 (49.9%)
- Females: 1,445 (50.1%)
Free Lunch Student Eligibility Breakdown
- Eligible for Reduced Lunch: 239 (8.3%)
- Eligible for Free Lunch: 1,073 (37.2%)
- Eligible for Either Reduced or Free Lunch: 1,312 (45.5%)
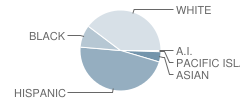
Student Enrollment Distribution by Race / Ethnicity

| Number | Percent | |
|---|---|---|
| American Indian | 11 | 0.4% |
| Black | 256 | 8.9% |
| Asian | 119 | 4.1% |
| Hispanic | 1,331 | 46.2% |
| White | 1,132 | 39.3% |
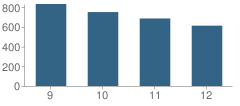
Number of Students Per Grade

| Number | Percent | |
|---|---|---|
| 9th Grade | 833 | 28.9% |
| 10th Grade | 751 | 26.0% |
| 11th Grade | 686 | 23.8% |
| 12th Grade | 613 | 21.3% |
Graduates Information (2010)
Graduation Rate
School:
91.7%
District:
86.2%
State:
78.6%
Teacher Education Background (2009)
Percent With Ph.D.
School:
86.2%
District:
8.6%
Percent With Master's Degree
School:
46.6%
District:
39.8%
Percent With Bachelor's Degree
School:
37.9%
District:
23.7%
Teacher Credentials & Experience (2009)
Percent of Teachers With Credentials: 96.1%
Number of Certificated Staff: 116.0
Average Number of Years of Teacher Experience: 14.6
Average Age
School:
42.7
District:
48.2
Source: CA Department of Education, Source: NCES 2009-2010
Sponsored Links
Test Scores and Performance Information
Overall School Rating
How is this determined?
The overall school rating shows that Polytechnic High School performed on average about the same as other schools across the state on CST state exams in the following subjects:
- CST Algebra I
- CST Algebra II
- CST Biology
- CST Chemistry
- CST Earth Science
- CST English-Language Arts
- CST General Mathematics
- CST Geometry
- CST Physics
- CST Science
- CST Summative High School Math
- CST U.S. History
- CST World History
AYP Results (2010)
Overall AYP Met: Yes
ELA AYP Met: Yes
Math AYP Met: Yes
ACT Exam Results (2009)
Percent of Students Taking ACT Exam: 15.9%
Average Combined Score: 21.3
Percent Scoring At or Above 21: 54.6%
SAT Exam Results (2009)
Percent of Students Taking SAT Exam: 42.7%
Average Combined Score: 1,528.3
Critical Reading Average: 500.8
Math Average: 521.0
Writing Average: 506.6
Percent Scoring At or Above 1500: 50.2%
CST - Test Proficiency by Grade and Subject
Grade 9 - % of students at or above proficiency
| School | District | State | |
|---|---|---|---|
| CST Algebra I Test | |||
| 2010 | 13.0% | 14.0% | 22.0% |
| 2009 | 13.0% | 13.0% | 21.0% |
| 2008 | 5.0% | 10.0% | 18.0% |
| CST Algebra II Test | |||
| 2010 | 60.0% | 64.0% | 69.0% |
| 2009 | 50.0% | 57.0% | 65.0% |
| 2008 | 32.0% | 49.0% | 66.0% |
| CST Biology Test | |||
| 2010 | 44.0% | 52.0% | 55.0% |
| 2009 | 38.0% | 47.0% | 51.0% |
| 2008 | 26.0% | 45.0% | 52.0% |
| CST Earth Science Test | |||
| 2010 | 13.0% | 33.0% | 35.0% |
| 2009 | 18.0% | 28.0% | 29.0% |
| 2008 | 3.0% | 30.0% | 31.0% |
| CST English-Language Arts Test | |||
| 2010 | 61.0% | 59.0% | 54.0% |
| 2009 | 53.0% | 52.0% | 50.0% |
| 2008 | 45.0% | 49.0% | 49.0% |
| CST General Mathematics Test | |||
| 2010 | 9.0% | 9.0% | 17.0% |
| 2009 | 3.0% | 2.0% | 17.0% |
| CST Geometry Test | |||
| 2010 | 34.0% | 33.0% | 46.0% |
| 2009 | 36.0% | 31.0% | 47.0% |
| 2008 | 28.0% | 32.0% | 43.0% |
Grade 10 - % of students at or above proficiency
| School | District | State | |
|---|---|---|---|
| CST Algebra I Test | |||
| 2010 | 10.0% | 12.0% | 12.0% |
| 2009 | 7.0% | 10.0% | 11.0% |
| 2008 | 6.0% | 8.0% | 9.0% |
| CST Algebra II Test | |||
| 2010 | 30.0% | 31.0% | 40.0% |
| 2009 | 13.0% | 24.0% | 37.0% |
| 2008 | 13.0% | 21.0% | 36.0% |
| CST Biology Test | |||
| 2010 | 26.0% | 29.0% | 38.0% |
| 2009 | 10.0% | 26.0% | 34.0% |
| 2008 | 14.0% | 25.0% | 35.0% |
| CST Chemistry Test | |||
| 2010 | 45.0% | 47.0% | 47.0% |
| 2009 | 38.0% | 45.0% | 44.0% |
| 2008 | 33.0% | 36.0% | 41.0% |
| CST Earth Science Test | |||
| 2010 | 36.0% | 32.0% | 29.0% |
| 2009 | 24.0% | 19.0% | 23.0% |
| 2008 | 22.0% | 18.0% | 23.0% |
| CST English-Language Arts Test | |||
| 2010 | 51.0% | 46.0% | 45.0% |
| 2009 | 44.0% | 42.0% | 44.0% |
| 2008 | 43.0% | 40.0% | 41.0% |
| CST Geometry Test | |||
| 2010 | 20.0% | 16.0% | 14.0% |
| 2009 | 8.0% | 13.0% | 14.0% |
| 2008 | 10.0% | 11.0% | 12.0% |
| CST Physics Test | |||
| 2010 | 34.0% | 39.0% | 44.0% |
| 2009 | 36.0% | 35.0% | 40.0% |
| 2008 | 22.0% | 26.0% | 36.0% |
| CST Science Test | |||
| 2010 | 48.0% | 45.0% | 46.0% |
| 2009 | 36.0% | 41.0% | 44.0% |
| 2008 | 38.0% | 37.0% | 40.0% |
| CST Summative High School Math Test | |||
| 2010 | 81.0% | 73.0% | 75.0% |
| 2009 | 46.0% | 58.0% | 71.0% |
| 2008 | 42.0% | 53.0% | 68.0% |
| CST World History Test | |||
| 2010 | 45.0% | 42.0% | 42.0% |
| 2009 | 37.0% | 36.0% | 38.0% |
| 2008 | 33.0% | 31.0% | 33.0% |
Grade 11 - % of students at or above proficiency
| School | District | State | |
|---|---|---|---|
| CST Algebra I Test | |||
| 2010 | 7.0% | 7.0% | 8.0% |
| 2009 | 10.0% | 6.0% | 8.0% |
| 2008 | 2.0% | 4.0% | 5.0% |
| CST Algebra II Test | |||
| 2010 | 11.0% | 13.0% | 14.0% |
| 2009 | 5.0% | 10.0% | 12.0% |
| 2008 | 9.0% | 9.0% | 11.0% |
| CST Biology Test | |||
| 2010 | 33.0% | 45.0% | 46.0% |
| 2009 | 35.0% | 39.0% | 41.0% |
| 2008 | 45.0% | 39.0% | 39.0% |
| CST Chemistry Test | |||
| 2010 | 36.0% | 25.0% | 30.0% |
| 2009 | 31.0% | 21.0% | 27.0% |
| 2008 | 19.0% | 18.0% | 25.0% |
| CST Earth Science Test | |||
| 2010 | 27.0% | 23.0% | 32.0% |
| 2009 | 37.0% | 19.0% | 26.0% |
| 2008 | 26.0% | 19.0% | 28.0% |
| CST English-Language Arts Test | |||
| 2010 | 53.0% | 42.0% | 42.0% |
| 2009 | 46.0% | 38.0% | 40.0% |
| 2008 | 41.0% | 37.0% | 37.0% |
| CST Geometry Test | |||
| 2010 | 6.0% | 7.0% | 6.0% |
| 2009 | 6.0% | 8.0% | 7.0% |
| 2008 | 5.0% | 4.0% | 6.0% |
| CST Physics Test | |||
| 2010 | 48.0% | 60.0% | 53.0% |
| 2009 | 50.0% | 54.0% | 50.0% |
| 2008 | 38.0% | 49.0% | 47.0% |
| CST Summative High School Math Test | |||
| 2010 | 40.0% | 39.0% | 50.0% |
| 2009 | 41.0% | 36.0% | 47.0% |
| 2008 | 31.0% | 30.0% | 43.0% |
| CST U.S. History Test | |||
| 2010 | 53.0% | 43.0% | 45.0% |
| 2009 | 51.0% | 41.0% | 44.0% |
| 2008 | 42.0% | 36.0% | 38.0% |
End of Course - % of students at or above proficiency
| School | District | State | |
|---|---|---|---|
| CST Algebra I Test | |||
| 2010 | 11.0% | 28.0% | 31.0% |
| 2009 | 11.0% | 23.0% | 28.0% |
| 2008 | 5.0% | 22.0% | 25.0% |
| CST Algebra II Test | |||
| 2010 | 30.0% | 30.0% | 31.0% |
| 2009 | 15.0% | 24.0% | 28.0% |
| 2008 | 16.0% | 21.0% | 27.0% |
| CST Biology Test | |||
| 2010 | 41.0% | 43.0% | 46.0% |
| 2009 | 36.0% | 37.0% | 42.0% |
| 2008 | 30.0% | 36.0% | 42.0% |
| CST Chemistry Test | |||
| 2010 | 43.0% | 38.0% | 38.0% |
| 2009 | 36.0% | 33.0% | 36.0% |
| 2008 | 29.0% | 28.0% | 32.0% |
| CST Earth Science Test | |||
| 2010 | 34.0% | 31.0% | 33.0% |
| 2009 | 25.0% | 25.0% | 28.0% |
| 2008 | 20.0% | 26.0% | 28.0% |
| CST General Mathematics Test | |||
| 2010 | 9.0% | 11.0% | 27.0% |
| 2009 | 3.0% | 8.0% | 26.0% |
| CST Geometry Test | |||
| 2010 | 23.0% | 28.0% | 27.0% |
| 2009 | 21.0% | 26.0% | 26.0% |
| 2008 | 16.0% | 25.0% | 24.0% |
| CST Physics Test | |||
| 2010 | 44.0% | 55.0% | 49.0% |
| 2009 | 44.0% | 48.0% | 46.0% |
| 2008 | 33.0% | 45.0% | 43.0% |
| CST Summative High School Math Test | |||
| 2010 | 49.0% | 46.0% | 54.0% |
| 2009 | 42.0% | 41.0% | 50.0% |
| 2008 | 35.0% | 36.0% | 47.0% |
| CST World History Test | |||
| 2010 | 45.0% | 42.0% | 41.0% |
| 2009 | 37.0% | 37.0% | 38.0% |
| 2008 | 33.0% | 30.0% | 33.0% |
Source: CA Department of Education 2009-2010
School Map and Similar Schools Nearby
Click to Activate Map of Nearby School Campuses
Private
Public
This School
Similar Schools Nearby
| Riverside Virtual School KG-12 | 39 Students | 1.8 miles away | Not Yet Rated | - |
| John W. North High School 9-12 | 2,401 Students | 2.5 miles away | ![]() 5 out of 5 | |
| Ramona High School 9-12 | 2,094 Students | 2.7 miles away | ![]() 2.5 out of 5 | |
| Arlington High School 9-12 | 2,171 Students | 4.4 miles away | ![]() 4 out of 5 | |
| Rubidoux High School 9-12 | 1,655 Students | 4.6 miles away | ![]() 4 out of 5 | |
| Martin Luther King Jr. High School 9-12 | 3,021 Students | 5.2 miles away | ![]() 5 out of 5 | |
| Patriot High School 9-12 | 2,417 Students | 5.9 miles away | Not Yet Rated | - |
| Norte Vista High School 9-12 | 2,373 Students | 5.9 miles away | Not Yet Rated | |
| Canyon Springs High School 9-12 | 2,584 Students | 6.3 miles away | ![]() 5 out of 5 | |
| Moreno Valley High School 9-12 | 2,412 Students | 6.9 miles away | Not Yet Rated | |
Compare This School To Nearby Schools ->
School Community Forum

Join a discussion about Polytechnic High School and talk to others in the community including students, parents, teachers, and administrators.
Popular Discussion Topics
- Admissions and Registration Questions (e.g. Dress Code and Discipline Policy)
- School Calendar and Upcoming Events (e.g. Graduation)
- After School Programs, Extracurricular Activities, and Athletics (e.g. Football)
- News and Announcements (e.g. Yearbook and Class Supply List Details)
- Graduate and Alumni Events (e.g. Organizing Class Reunions)
Navigation
Can't Find What You Are Looking For?
Rankings
Nearby Cities
Sponsored Links
K-12 Articles
Teaching Children with Learning Disabilities to Make Friends
Children with learning disabilities often have trouble making and retaining friendships. Some kids...
The Importance of Ninth Grade
Students who are entering ninth grade do not realize the importance of the critical decisions they...
Teacher Tenure: A Double-Edged Sword
Teacher Tenure (the policy making it almost impossible to fire teachers) has noble roots. It was...


(5 / 5) 

