Ramona High School
Rating
Not Available
Not Available

2.5 out of 5 | 3 Reviews
Find Old Friends From Ramona High School
Use the form below to search for alumni from Ramona High School.
School Description
School Summary and Highlights
- Enrolls 2,094 high school students from grades 9-12
- Ranks 675th out of 1,197 high schools in CA.
- 2010 Overall School AYP Met Status: No
Additional Contact Information
- Mailing Address: 7675 Magnolia Ave., Riverside, CA 92504
School District Details
- Riverside Unified School District
- Per-Pupil Spending: $8,268
- Graduation Rate: 66.6%
- Dropout Rate: 3.4%
- Students Per Teacher: 23.2
- Enrolled Students: 42,501
Faculty Details and Student Enrollment
Students and Faculty
- Total Students Enrolled: 2,094
- Total Full Time "Equivalent" Teachers: 87.8
- Average Student-To-Teacher Ratio: 23.9
Students Gender Breakdown
- Males: 1,017 (48.6%)
- Females: 1,077 (51.4%)
Free Lunch Student Eligibility Breakdown
- Eligible for Reduced Lunch: 394 (18.8%)
- Eligible for Free Lunch: 1,196 (57.1%)
- Eligible for Either Reduced or Free Lunch: 1,590 (75.9%)
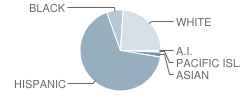
Student Enrollment Distribution by Race / Ethnicity
| Number | Percent | |
|---|---|---|
| American Indian | 8 | 0.4% |
| Black | 137 | 6.5% |
| Asian | 42 | 2.0% |
| Hispanic | 1,377 | 65.8% |
| White | 495 | 23.6% |
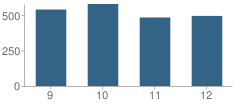
Number of Students Per Grade
| Number | Percent | |
|---|---|---|
| 9th Grade | 539 | 25.7% |
| 10th Grade | 578 | 27.6% |
| 11th Grade | 483 | 23.1% |
| 12th Grade | 494 | 23.6% |
Graduates Information (2010)
Graduation Rate
School:
86.9%
District:
86.2%
State:
78.6%
Teacher Education Background (2009)
Percent With Ph.D.
School:
2.1%
District:
8.6%
Percent With Master's Degree
School:
44.3%
District:
39.8%
Percent With Bachelor's Degree
School:
41.2%
District:
23.7%
Teacher Credentials & Experience (2009)
Percent of Teachers With Credentials: 95.3%
Number of Certificated Staff: 97.0
Average Number of Years of Teacher Experience: 13.3
Average Age
School:
41.9
District:
48.2
Source: CA Department of Education, Source: NCES 2009-2010
School Ratings and Reviews
Overall Rating: 2.5

2.5 out of 5 | 3 Reviews
The Overall Rating is the school's average rating from parents, students, school faculty and staff. The highest rating is five apples and the lowest is one apple.
Share Your Review About This School
3 reviews for Ramona High School
- Reviewed by Former Student on January 10, 2010
- Rating:
 (5 / 5) Flag as inappropriate
 - Riverside Ramona High School is an outstanding high school. Theres a good reason why Ramona is awared "The Distinguished School Award", for instance I got into University of California, Berkeley.
- Reviewed by Parent/Guardian on April 11, 2008
- Rating:
 (1 / 5) Flag as inappropriate
 - There are many problems with this school, besides academically. Let's start with the staff. Most of them are very rude and uncaring about the students, and to the parents as well. They seem to be allowed to threaten and use foul language with the children and manhandle them, which I have been witness to, on more than one occasion. If an incident occurs they sweep it under the rug. When my son was jumped, I was asked by the (...) what he did to deserve it? Needless to say my son no longer attends this school. Yet for some reason they were awarded The Distinguished School Award, I find that so amusing. They fail the kids, by not helping them if they're struggling. For some reason these teachers seem to think it's a waste of their time. Go figure. I guess that wasn't in the job description.
- Reviewed by Parent/Guardian on May 08, 2007
- Rating: (1 / 5) Flag as inappropriate
- it sucks
School Map and Similar Schools Nearby
Click to Activate Map of Nearby School Campuses
Private
Public
This School
Similar Schools Nearby
| Arlington High School 9-12 | 2,171 Students | 2.0 miles away |  4 out of 5 | |
| Polytechnic High School 9-12 | 2,883 Students | 2.7 miles away |  5 out of 5 | |
| Riverside Virtual School KG-12 | 39 Students | 3.3 miles away | Not Yet Rated | - |
| Norte Vista High School 9-12 | 2,373 Students | 3.4 miles away | Not Yet Rated | |
| Rubidoux High School 9-12 | 1,655 Students | 4.2 miles away | 4 out of 5 | |
| La Sierra High School 9-12 | 3,175 Students | 4.4 miles away |  3.5 out of 5 | |
| John W. North High School 9-12 | 2,401 Students | 5.0 miles away | 5 out of 5 | |
| Patriot High School 9-12 | 2,417 Students | 5.1 miles away | Not Yet Rated | - |
| Martin Luther King Jr. High School 9-12 | 3,021 Students | 6.0 miles away | 5 out of 5 | |
| Citrus Hill High School 9-12 | 1,956 Students | 7.4 miles away | 4 out of 5 | |
Compare This School To Nearby Schools ->
School Community Forum

Join a discussion about Ramona High School and talk to others in the community including students, parents, teachers, and administrators.
Popular Discussion Topics
- Admissions and Registration Questions (e.g. Dress Code and Discipline Policy)
- School Calendar and Upcoming Events (e.g. Graduation)
- After School Programs, Extracurricular Activities, and Athletics (e.g. Football)
- News and Announcements (e.g. Yearbook and Class Supply List Details)
- Graduate and Alumni Events (e.g. Organizing Class Reunions)
Navigation
Can't Find What You Are Looking For?
Rankings
Nearby Cities
Sponsored Links
K-12 Articles

Kids and Competition
In the backyard, the classroom, the community and while participating in sports and other...
In the backyard, the classroom, the community and while participating in sports and other...

Help Your Child Achieve Success in Middle School
Middle school is for children between the ages of 10 and 14 years. At this time children begin to...
Middle school is for children between the ages of 10 and 14 years. At this time children begin to...

Where in the World is Carmen Sandiego?
One of the sensations on YouTube highlights the state of our education system. The spot was...
One of the sensations on YouTube highlights the state of our education system. The spot was...