Arlington High School
Rating
Not Available
Not Available

4 out of 5 | 1 Review
Find Old Friends From Arlington High School
Use the form below to search for alumni from Arlington High School.
School Description
School Summary and Highlights
- Enrolls 2,171 high school students from grades 9-12
- Ranks 954th out of 1,197 high schools in CA.
- 2010 Overall School AYP Met Status: No
Additional Contact Information
- Mailing Address: 2951 Jackson St., Riverside, CA 92503
School District Details
- Riverside Unified School District
- Per-Pupil Spending: $8,268
- Graduation Rate: 66.6%
- Dropout Rate: 3.4%
- Students Per Teacher: 23.2
- Enrolled Students: 42,501
Faculty Details and Student Enrollment
Students and Faculty
- Total Students Enrolled: 2,171
- Total Full Time "Equivalent" Teachers: 85.4
- Average Student-To-Teacher Ratio: 25.4
Students Gender Breakdown
- Males: 1,105 (50.9%)
- Females: 1,066 (49.1%)
Free Lunch Student Eligibility Breakdown
- Eligible for Reduced Lunch: 315 (14.5%)
- Eligible for Free Lunch: 1,063 (49.0%)
- Eligible for Either Reduced or Free Lunch: 1,378 (63.5%)
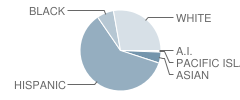
Student Enrollment Distribution by Race / Ethnicity
| Number | Percent | |
|---|---|---|
| American Indian | 8 | 0.4% |
| Black | 147 | 6.8% |
| Asian | 96 | 4.4% |
| Hispanic | 1,297 | 59.7% |
| White | 598 | 27.5% |
Number of Students Per Grade

| Number | Percent | |
|---|---|---|
| 9th Grade | 737 | 33.9% |
| 10th Grade | 577 | 26.6% |
| 11th Grade | 401 | 18.5% |
| 12th Grade | 456 | 21.0% |
Graduates Information (2010)
Graduation Rate
School:
94.6%
District:
86.2%
State:
78.6%
Teacher Education Background (2009)
Percent With Master's Degree
School:
30.9%
District:
39.8%
Percent With Bachelor's Degree
School:
53.6%
District:
23.7%
Percent With Ph.D.
School:
3.1%
District:
8.6%
Teacher Credentials & Experience (2009)
Average Age
School:
43.0
District:
48.2
Average Number of Years of Teacher Experience: 13.6
Number of Certificated Staff: 97.0
Percent of Teachers With Credentials: 96.5%
Source: CA Department of Education, Source: NCES 2009-2010
School Ratings and Reviews
Overall Rating: 4

4 out of 5 | 1 Review
The Overall Rating is the school's average rating from parents, students, school faculty and staff. The highest rating is five apples and the lowest is one apple.
Share Your Review About This School
1 review for Arlington High School
- Reviewed by Student on August 13, 2008
- Rating:
 (4 / 5) Flag as inappropriate
 - THIS SCHOOL IS COOL
WOW!
School Map and Similar Schools Nearby
Click to Activate Map of Nearby School Campuses
Private
Public
This School
Similar Schools Nearby
| Ramona High School 9-12 | 2,094 Students | 2.0 miles away |  2.5 out of 5 | |
| La Sierra High School 9-12 | 3,175 Students | 3.1 miles away |  3.5 out of 5 | |
| Norte Vista High School 9-12 | 2,373 Students | 3.6 miles away | Not Yet Rated | |
| Polytechnic High School 9-12 | 2,883 Students | 4.4 miles away |  5 out of 5 | |
| Riverside Virtual School KG-12 | 39 Students | 5.3 miles away | Not Yet Rated | - |
| Rubidoux High School 9-12 | 1,655 Students | 5.9 miles away |  4 out of 5 | |
| Martin Luther King Jr. High School 9-12 | 3,021 Students | 5.9 miles away | 5 out of 5 | |
| Patriot High School 9-12 | 2,417 Students | 6.6 miles away | Not Yet Rated | - |
| Norco High School 9-12 | 2,159 Students | 6.8 miles away | Not Yet Rated | |
| John W. North High School 9-12 | 2,401 Students | 6.8 miles away | 5 out of 5 | |
Compare This School To Nearby Schools ->
School Community Forum

Join a discussion about Arlington High School and talk to others in the community including students, parents, teachers, and administrators.
Popular Discussion Topics
- Admissions and Registration Questions (e.g. Dress Code and Discipline Policy)
- School Calendar and Upcoming Events (e.g. Graduation)
- After School Programs, Extracurricular Activities, and Athletics (e.g. Football)
- News and Announcements (e.g. Yearbook and Class Supply List Details)
- Graduate and Alumni Events (e.g. Organizing Class Reunions)
Navigation
Can't Find What You Are Looking For?
Rankings
Nearby Cities
Sponsored Links
K-12 Articles

What to Do when Your Student is Held Back
Kids develop at different speeds, and everyone has different skills and abilities. School is easy...
Kids develop at different speeds, and everyone has different skills and abilities. School is easy...

National Memories
Few events are seared into our memory, and bring the country together-not as Democrat and...
Few events are seared into our memory, and bring the country together-not as Democrat and...

Special Needs Education: Your Child, Your Rights
Many children today have special needs that make it difficult for them to learn. It’s imperative...
Many children today have special needs that make it difficult for them to learn. It’s imperative...