Norco High School

No Reviews Yet
Find Old Friends From Norco High School
Use the form below to search for alumni from Norco High School.
School Description
School Summary and Highlights
- Enrolls 2,159 high school students from grades 9-12
- Ranks 631st out of 1,197 high schools in CA.
- 2010 Overall School AYP Met Status: No
Additional Contact Information
- Mailing Address: 2065 Temescal Ave., Norco, CA 92860
School District Details
- Corona-Norco Unified School District
- Per-Pupil Spending: $8,078
- Graduation Rate: 85.9%
- Dropout Rate: 1.5%
- Students Per Teacher: 23.3
- Enrolled Students: 52,024
Faculty Details and Student Enrollment
Students and Faculty
- Total Students Enrolled: 2,159
- Total Full Time "Equivalent" Teachers: 89.2
- Average Student-To-Teacher Ratio: 24.2
Students Gender Breakdown
- Males: 1,117 (51.7%)
- Females: 1,042 (48.3%)
Free Lunch Student Eligibility Breakdown
- Eligible for Reduced Lunch: 259 (12.0%)
- Eligible for Free Lunch: 520 (24.1%)
- Eligible for Either Reduced or Free Lunch: 779 (36.1%)
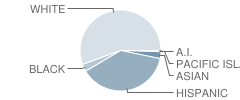
Student Enrollment Distribution by Race / Ethnicity

| Number | Percent | |
|---|---|---|
| American Indian | 9 | 0.4% |
| Black | 64 | 3.0% |
| Asian | 59 | 2.7% |
| Hispanic | 809 | 37.5% |
| White | 1,175 | 54.4% |
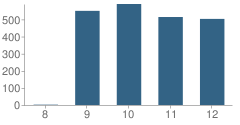
Number of Students Per Grade

| Number | Percent | |
|---|---|---|
| 8th Grade | 2 | 0.09% |
| 9th Grade | 550 | 25.5% |
| 10th Grade | 590 | 27.3% |
| 11th Grade | 514 | 23.8% |
| 12th Grade | 503 | 23.3% |
Graduates Information (2010)
Graduation Rate
School:
90.3%
District:
91.8%
State:
78.6%
Teacher Education Background (2009)
Percent With Ph.D.
School:
2.0%
District:
4.5%
Percent With Master's Degree
School:
63.4%
District:
60.1%
Percent With Bachelor's Degree
School:
4.0%
District:
3.4%
Teacher Credentials & Experience (2009)
Percent of Teachers With Credentials: 100.0%
Number of Certificated Staff: 101.0
Average Number of Years of Teacher Experience: 13.7
Average Age
School:
41.3
District:
45.0
Source: CA Department of Education, Source: NCES 2009-2010
School Ratings and Reviews
Be The First To Review Norco High School!
Sponsored Links
Test Scores and Performance Information
Overall School Rating
How is this determined?
The overall school rating shows that Norco High School performed on average about the same as other schools across the state on CST state exams in the following subjects:
- CST Algebra I
- CST Algebra II
- CST Biology
- CST Chemistry
- CST Earth Science
- CST English-Language Arts
- CST General Mathematics
- CST Geometry
- CST Physics
- CST Science
- CST Summative High School Math
- CST U.S. History
- CST World History
AYP Results (2010)
Overall AYP Met: No
ELA AYP Met: No
Math AYP Met: No
ACT Exam Results (2009)
Percent of Students Taking ACT Exam: 14.5%
Average Combined Score: 20.3
Percent Scoring At or Above 21: 45.2%
SAT Exam Results (2009)
Percent of Students Taking SAT Exam: 40.5%
Average Combined Score: 1,436.1
Critical Reading Average: 477.9
Math Average: 489.1
Writing Average: 469.1
Percent Scoring At or Above 1500: 39.9%
CST - Test Proficiency by Grade and Subject
Grade 9 - % of students at or above proficiency
| School | District | State | |
|---|---|---|---|
| CST Algebra I Test | |||
| 2010 | 15.0% | 12.0% | 22.0% |
| 2009 | 14.0% | 11.0% | 21.0% |
| 2008 | 12.0% | 7.0% | 18.0% |
| CST Biology Test | |||
| 2010 | 47.0% | 53.0% | 55.0% |
| 2009 | 42.0% | 46.0% | 51.0% |
| 2008 | 41.0% | 43.0% | 52.0% |
| CST English-Language Arts Test | |||
| 2010 | 64.0% | 63.0% | 54.0% |
| 2009 | 57.0% | 56.0% | 50.0% |
| 2008 | 51.0% | 52.0% | 49.0% |
| CST General Mathematics Test | |||
| 2010 | 14.0% | 8.0% | 17.0% |
| 2009 | 8.0% | 6.0% | 17.0% |
| CST Geometry Test | |||
| 2010 | 35.0% | 41.0% | 46.0% |
| 2009 | 53.0% | 38.0% | 47.0% |
| 2008 | 37.0% | 28.0% | 43.0% |
| CST World History Test | |||
| 2010 | 80.0% | 45.0% | 45.0% |
| 2009 | 54.0% | 48.0% | 41.0% |
| CST Algebra II Test | |||
| 2009 | 54.0% | 54.0% | 65.0% |
| CST Earth Science Test | |||
| 2009 | 18.0% | 10.0% | 29.0% |
| 2008 | 18.0% | 12.0% | 31.0% |
Grade 10 - % of students at or above proficiency
| School | District | State | |
|---|---|---|---|
| CST Algebra I Test | |||
| 2010 | 6.0% | 12.0% | 12.0% |
| 2009 | 9.0% | 8.0% | 11.0% |
| 2008 | 3.0% | 2.0% | 9.0% |
| CST Algebra II Test | |||
| 2010 | 44.0% | 28.0% | 40.0% |
| 2009 | 31.0% | 21.0% | 37.0% |
| 2008 | 27.0% | 15.0% | 36.0% |
| CST Biology Test | |||
| 2010 | 24.0% | 31.0% | 38.0% |
| 2009 | 41.0% | 33.0% | 34.0% |
| 2008 | 48.0% | 30.0% | 35.0% |
| CST Chemistry Test | |||
| 2010 | 47.0% | 52.0% | 47.0% |
| 2009 | 42.0% | 48.0% | 44.0% |
| 2008 | 37.0% | 38.0% | 41.0% |
| CST Earth Science Test | |||
| 2010 | 31.0% | 30.0% | 29.0% |
| 2009 | 23.0% | 25.0% | 23.0% |
| 2008 | 25.0% | 22.0% | 23.0% |
| CST English-Language Arts Test | |||
| 2010 | 46.0% | 49.0% | 45.0% |
| 2009 | 46.0% | 47.0% | 44.0% |
| 2008 | 42.0% | 43.0% | 41.0% |
| CST Geometry Test | |||
| 2010 | 4.0% | 6.0% | 14.0% |
| 2009 | 8.0% | 6.0% | 14.0% |
| 2008 | 6.0% | 6.0% | 12.0% |
| CST Science Test | |||
| 2010 | 46.0% | 49.0% | 46.0% |
| 2009 | 45.0% | 46.0% | 44.0% |
| 2008 | 38.0% | 40.0% | 40.0% |
| CST World History Test | |||
| 2010 | 45.0% | 46.0% | 42.0% |
| 2009 | 40.0% | 40.0% | 38.0% |
| 2008 | 40.0% | 35.0% | 33.0% |
Grade 11 - % of students at or above proficiency
| School | District | State | |
|---|---|---|---|
| CST Algebra II Test | |||
| 2010 | 13.0% | 10.0% | 14.0% |
| 2009 | 7.0% | 7.0% | 12.0% |
| 2008 | 6.0% | 6.0% | 11.0% |
| CST Biology Test | |||
| 2010 | 45.0% | 43.0% | 46.0% |
| 2009 | 49.0% | 40.0% | 41.0% |
| 2008 | 57.0% | 36.0% | 39.0% |
| CST Chemistry Test | |||
| 2010 | 41.0% | 38.0% | 30.0% |
| 2009 | 16.0% | 31.0% | 27.0% |
| 2008 | 31.0% | 30.0% | 25.0% |
| CST Earth Science Test | |||
| 2010 | 32.0% | 34.0% | 32.0% |
| 2009 | 33.0% | 30.0% | 26.0% |
| 2008 | 44.0% | 31.0% | 28.0% |
| CST English-Language Arts Test | |||
| 2010 | 44.0% | 45.0% | 42.0% |
| 2009 | 43.0% | 44.0% | 40.0% |
| 2008 | 47.0% | 38.0% | 37.0% |
| CST Geometry Test | |||
| 2010 | 2.0% | 3.0% | 6.0% |
| 2009 | 4.0% | 4.0% | 7.0% |
| 2008 | 4.0% | 3.0% | 6.0% |
| CST Physics Test | |||
| 2010 | 48.0% | 68.0% | 53.0% |
| 2009 | 55.0% | 53.0% | 50.0% |
| 2008 | 43.0% | 42.0% | 47.0% |
| CST Summative High School Math Test | |||
| 2010 | 36.0% | 33.0% | 50.0% |
| 2009 | 26.0% | 28.0% | 47.0% |
| 2008 | 21.0% | 23.0% | 43.0% |
| CST U.S. History Test | |||
| 2010 | 45.0% | 48.0% | 45.0% |
| 2009 | 48.0% | 46.0% | 44.0% |
| 2008 | 41.0% | 36.0% | 38.0% |
| CST Algebra I Test | |||
| 2009 | 10.0% | 8.0% | 8.0% |
| 2008 | 8.0% | 4.0% | 5.0% |
End of Course - % of students at or above proficiency
| School | District | State | |
|---|---|---|---|
| CST Algebra I Test | |||
| 2010 | 11.0% | 20.0% | 31.0% |
| 2009 | 12.0% | 23.0% | 28.0% |
| 2008 | 9.0% | 16.0% | 25.0% |
| CST Algebra II Test | |||
| 2010 | 34.0% | 22.0% | 31.0% |
| 2009 | 23.0% | 17.0% | 28.0% |
| 2008 | 22.0% | 11.0% | 27.0% |
| CST Biology Test | |||
| 2010 | 45.0% | 49.0% | 46.0% |
| 2009 | 43.0% | 45.0% | 42.0% |
| 2008 | 43.0% | 41.0% | 42.0% |
| CST Chemistry Test | |||
| 2010 | 45.0% | 48.0% | 38.0% |
| 2009 | 34.0% | 43.0% | 36.0% |
| 2008 | 35.0% | 35.0% | 32.0% |
| CST Earth Science Test | |||
| 2010 | 31.0% | 31.0% | 33.0% |
| 2009 | 24.0% | 26.0% | 28.0% |
| 2008 | 28.0% | 25.0% | 28.0% |
| CST General Mathematics Test | |||
| 2010 | 14.0% | 6.0% | 27.0% |
| 2009 | 8.0% | 5.0% | 26.0% |
| CST Geometry Test | |||
| 2010 | 17.0% | 28.0% | 27.0% |
| 2009 | 27.0% | 23.0% | 26.0% |
| 2008 | 21.0% | 17.0% | 24.0% |
| CST Physics Test | |||
| 2010 | 49.0% | 67.0% | 49.0% |
| 2009 | 53.0% | 52.0% | 46.0% |
| 2008 | 43.0% | 42.0% | 43.0% |
| CST Summative High School Math Test | |||
| 2010 | 37.0% | 39.0% | 54.0% |
| 2009 | 27.0% | 33.0% | 50.0% |
| 2008 | 22.0% | 28.0% | 47.0% |
| CST World History Test | |||
| 2010 | 45.0% | 46.0% | 41.0% |
| 2009 | 40.0% | 40.0% | 38.0% |
| 2008 | 39.0% | 34.0% | 33.0% |
Source: CA Department of Education 2009-2010
School Map and Similar Schools Nearby
Click to Activate Map of Nearby School Campuses
Private
Public
This School
Similar Schools Nearby
| Eleanor Roosevelt High School 9-12 | 3,102 Students | 3.1 miles away | ![]() 4 out of 5 | |
| Corona High School 9-12 | 3,248 Students | 3.4 miles away | ![]() 5 out of 5 | |
| La Sierra High School 9-12 | 3,175 Students | 3.7 miles away | ![]() 3.5 out of 5 | |
| Centennial High School 9-12 | 3,053 Students | 3.9 miles away | ![]() 4 out of 5 | |
| Norte Vista High School 9-12 | 2,373 Students | 5.1 miles away | Not Yet Rated | |
| Santiago High School 9-12 | 3,303 Students | 5.2 miles away | ![]() 5 out of 5 | |
| Arlington High School 9-12 | 2,171 Students | 6.8 miles away | ![]() 4 out of 5 | |
| Ramona High School 9-12 | 2,094 Students | 7.9 miles away | ![]() 2.5 out of 5 | |
| Patriot High School 9-12 | 2,417 Students | 8.8 miles away | Not Yet Rated | - |
| Rubidoux High School 9-12 | 1,655 Students | 9.2 miles away | ![]() 4 out of 5 | |
Compare This School To Nearby Schools ->
School Community Forum

Join a discussion about Norco High School and talk to others in the community including students, parents, teachers, and administrators.
Popular Discussion Topics
- Admissions and Registration Questions (e.g. Dress Code and Discipline Policy)
- School Calendar and Upcoming Events (e.g. Graduation)
- After School Programs, Extracurricular Activities, and Athletics (e.g. Football)
- News and Announcements (e.g. Yearbook and Class Supply List Details)
- Graduate and Alumni Events (e.g. Organizing Class Reunions)
Navigation
Can't Find What You Are Looking For?
Rankings
Nearby Cities
Sponsored Links
K-12 Articles
Asperger Syndrome: A Developmental Disorder on the Autism Spectrum
Asperger Syndrome, also known as Pervasive Developmental Disorder is on the high functioning end of...
Promoting Childhood Literacy
The number of American adults who are illiterate is astounding. People who lack the ability to read...
Teaching Children Respect
Statistics prove that there are many different family types in today's society. Grandparents or a...


