Martin Luther King Jr. High School

5 out of 5 | 2 Reviews
Find Old Friends From Martin Luther King Jr. High School
Use the form below to search for alumni from Martin Luther King Jr. High School.
School Description
School Summary and Highlights
- Enrolls 3,021 high school students from grades 9-12
- Ranks 271st out of 1,197 high schools in CA.
- 2010 Overall School AYP Met Status: Yes
School District Details
- Riverside Unified School District
- Per-Pupil Spending: $8,268
- Graduation Rate: 66.6%
- Dropout Rate: 3.4%
- Students Per Teacher: 23.2
- Enrolled Students: 42,501
Faculty Details and Student Enrollment
Students and Faculty
- Total Students Enrolled: 3,021
- Total Full Time "Equivalent" Teachers: 124.4
- Average Student-To-Teacher Ratio: 24.3
Students Gender Breakdown
- Males: 1,560 (51.6%)
- Females: 1,461 (48.4%)
Free Lunch Student Eligibility Breakdown
- Eligible for Reduced Lunch: 108 (3.6%)
- Eligible for Free Lunch: 179 (5.9%)
- Eligible for Either Reduced or Free Lunch: 287 (9.5%)
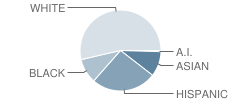
Student Enrollment Distribution by Race / Ethnicity

| Number | Percent | |
|---|---|---|
| American Indian | 14 | 0.5% |
| Black | 298 | 9.9% |
| Asian | 303 | 10.0% |
| Hispanic | 786 | 26.0% |
| White | 1,620 | 53.6% |
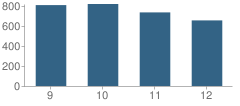
Number of Students Per Grade

| Number | Percent | |
|---|---|---|
| 9th Grade | 809 | 26.8% |
| 10th Grade | 820 | 27.1% |
| 11th Grade | 736 | 24.4% |
| 12th Grade | 656 | 21.7% |
Graduates Information (2010)
Graduation Rate
School:
95.9%
District:
86.2%
State:
78.6%
Teacher Education Background (2009)
Percent With Ph.D.
School:
82.0%
District:
8.6%
Percent With Master's Degree
School:
43.4%
District:
39.8%
Percent With Bachelor's Degree
School:
45.1%
District:
23.7%
Teacher Credentials & Experience (2009)
Percent of Teachers With Credentials: 98.2%
Number of Certificated Staff: 122.0
Average Number of Years of Teacher Experience: 13.4
Average Age
School:
41.3
District:
48.2
Source: CA Department of Education, Source: NCES 2009-2010
Sponsored Links
Test Scores and Performance Information
Overall School Rating
How is this determined?
The overall school rating shows that Martin Luther King Jr. High School performed on average better than many other schools across the state on CST state exams in the following subjects:
- CST Algebra I
- CST Algebra II
- CST Biology
- CST Chemistry
- CST Earth Science
- CST English-Language Arts
- CST General Mathematics
- CST Geometry
- CST Physics
- CST Science
- CST Summative High School Math
- CST U.S. History
- CST World History
AYP Results (2010)
Overall AYP Met: Yes
ELA AYP Met: Yes
Math AYP Met: Yes
ACT Exam Results (2009)
Percent of Students Taking ACT Exam: 10.9%
Average Combined Score: 22.0
Percent Scoring At or Above 21: 60.8%
SAT Exam Results (2009)
Percent of Students Taking SAT Exam: 46.0%
Average Combined Score: 1,515.1
Critical Reading Average: 496.6
Math Average: 517.9
Writing Average: 500.6
Percent Scoring At or Above 1500: 49.7%
CST - Test Proficiency by Grade and Subject
Grade 9 - % of students at or above proficiency
| School | District | State | |
|---|---|---|---|
| CST Algebra I Test | |||
| 2010 | 17.0% | 14.0% | 22.0% |
| 2009 | 27.0% | 13.0% | 21.0% |
| 2008 | 21.0% | 10.0% | 18.0% |
| CST Algebra II Test | |||
| 2010 | 78.0% | 64.0% | 69.0% |
| 2009 | 77.0% | 57.0% | 65.0% |
| 2008 | 80.0% | 49.0% | 66.0% |
| CST Biology Test | |||
| 2010 | 82.0% | 52.0% | 55.0% |
| 2009 | 76.0% | 47.0% | 51.0% |
| 2008 | 83.0% | 45.0% | 52.0% |
| CST Earth Science Test | |||
| 2010 | 49.0% | 33.0% | 35.0% |
| 2009 | 44.0% | 28.0% | 29.0% |
| 2008 | 50.0% | 30.0% | 31.0% |
| CST English-Language Arts Test | |||
| 2010 | 69.0% | 59.0% | 54.0% |
| 2009 | 69.0% | 52.0% | 50.0% |
| 2008 | 65.0% | 49.0% | 49.0% |
| CST General Mathematics Test | |||
| 2010 | 7.0% | 9.0% | 17.0% |
| 2009 | 4.0% | 2.0% | 17.0% |
| CST Geometry Test | |||
| 2010 | 43.0% | 33.0% | 46.0% |
| 2009 | 49.0% | 31.0% | 47.0% |
| 2008 | 47.0% | 32.0% | 43.0% |
Grade 10 - % of students at or above proficiency
| School | District | State | |
|---|---|---|---|
| CST Algebra I Test | |||
| 2010 | 23.0% | 12.0% | 12.0% |
| 2009 | 21.0% | 10.0% | 11.0% |
| 2008 | 22.0% | 8.0% | 9.0% |
| CST Algebra II Test | |||
| 2010 | 51.0% | 31.0% | 40.0% |
| 2009 | 37.0% | 24.0% | 37.0% |
| 2008 | 32.0% | 21.0% | 36.0% |
| CST Biology Test | |||
| 2010 | 45.0% | 29.0% | 38.0% |
| 2009 | 41.0% | 26.0% | 34.0% |
| 2008 | 40.0% | 25.0% | 35.0% |
| CST Chemistry Test | |||
| 2010 | 69.0% | 47.0% | 47.0% |
| 2009 | 67.0% | 45.0% | 44.0% |
| 2008 | 60.0% | 36.0% | 41.0% |
| CST Earth Science Test | |||
| 2010 | 40.0% | 32.0% | 29.0% |
| 2009 | 30.0% | 19.0% | 23.0% |
| 2008 | 12.0% | 18.0% | 23.0% |
| CST English-Language Arts Test | |||
| 2010 | 62.0% | 46.0% | 45.0% |
| 2009 | 59.0% | 42.0% | 44.0% |
| 2008 | 54.0% | 40.0% | 41.0% |
| CST Geometry Test | |||
| 2010 | 27.0% | 16.0% | 14.0% |
| 2009 | 29.0% | 13.0% | 14.0% |
| 2008 | 14.0% | 11.0% | 12.0% |
| CST Physics Test | |||
| 2010 | 52.0% | 39.0% | 44.0% |
| CST Science Test | |||
| 2010 | 60.0% | 45.0% | 46.0% |
| 2009 | 63.0% | 41.0% | 44.0% |
| 2008 | 54.0% | 37.0% | 40.0% |
| CST Summative High School Math Test | |||
| 2010 | 84.0% | 73.0% | 75.0% |
| 2009 | 80.0% | 58.0% | 71.0% |
| 2008 | 73.0% | 53.0% | 68.0% |
| CST World History Test | |||
| 2010 | 51.0% | 42.0% | 42.0% |
| 2009 | 51.0% | 36.0% | 38.0% |
| 2008 | 45.0% | 31.0% | 33.0% |
Grade 11 - % of students at or above proficiency
| School | District | State | |
|---|---|---|---|
| CST Algebra I Test | |||
| 2010 | 13.0% | 7.0% | 8.0% |
| 2009 | 13.0% | 6.0% | 8.0% |
| 2008 | 14.0% | 4.0% | 5.0% |
| CST Algebra II Test | |||
| 2010 | 24.0% | 13.0% | 14.0% |
| 2009 | 15.0% | 10.0% | 12.0% |
| 2008 | 13.0% | 9.0% | 11.0% |
| CST Biology Test | |||
| 2010 | 65.0% | 45.0% | 46.0% |
| 2009 | 59.0% | 39.0% | 41.0% |
| 2008 | 47.0% | 39.0% | 39.0% |
| CST Chemistry Test | |||
| 2010 | 45.0% | 25.0% | 30.0% |
| 2009 | 33.0% | 21.0% | 27.0% |
| 2008 | 34.0% | 18.0% | 25.0% |
| CST Earth Science Test | |||
| 2010 | 46.0% | 23.0% | 32.0% |
| 2009 | 15.0% | 19.0% | 26.0% |
| 2008 | 26.0% | 19.0% | 28.0% |
| CST English-Language Arts Test | |||
| 2010 | 56.0% | 42.0% | 42.0% |
| 2009 | 56.0% | 38.0% | 40.0% |
| 2008 | 55.0% | 37.0% | 37.0% |
| CST Geometry Test | |||
| 2010 | 20.0% | 7.0% | 6.0% |
| 2009 | 16.0% | 8.0% | 7.0% |
| 2008 | 6.0% | 4.0% | 6.0% |
| CST Physics Test | |||
| 2010 | 72.0% | 60.0% | 53.0% |
| 2009 | 70.0% | 54.0% | 50.0% |
| 2008 | 73.0% | 49.0% | 47.0% |
| CST Summative High School Math Test | |||
| 2010 | 49.0% | 39.0% | 50.0% |
| 2009 | 43.0% | 36.0% | 47.0% |
| 2008 | 37.0% | 30.0% | 43.0% |
| CST U.S. History Test | |||
| 2010 | 55.0% | 43.0% | 45.0% |
| 2009 | 54.0% | 41.0% | 44.0% |
| 2008 | 53.0% | 36.0% | 38.0% |
| CST World History Test | |||
| 2010 | 27.0% | 15.0% | 15.0% |
End of Course - % of students at or above proficiency
| School | District | State | |
|---|---|---|---|
| CST Algebra I Test | |||
| 2010 | 19.0% | 28.0% | 31.0% |
| 2009 | 23.0% | 23.0% | 28.0% |
| 2008 | 19.0% | 22.0% | 25.0% |
| CST Algebra II Test | |||
| 2010 | 47.0% | 30.0% | 31.0% |
| 2009 | 35.0% | 24.0% | 28.0% |
| 2008 | 32.0% | 21.0% | 27.0% |
| CST Biology Test | |||
| 2010 | 61.0% | 43.0% | 46.0% |
| 2009 | 56.0% | 37.0% | 42.0% |
| 2008 | 51.0% | 36.0% | 42.0% |
| CST Chemistry Test | |||
| 2010 | 57.0% | 38.0% | 38.0% |
| 2009 | 48.0% | 33.0% | 36.0% |
| 2008 | 45.0% | 28.0% | 32.0% |
| CST Earth Science Test | |||
| 2010 | 48.0% | 31.0% | 33.0% |
| 2009 | 41.0% | 25.0% | 28.0% |
| 2008 | 48.0% | 26.0% | 28.0% |
| CST General Mathematics Test | |||
| 2010 | 7.0% | 11.0% | 27.0% |
| 2009 | 4.0% | 8.0% | 26.0% |
| CST Geometry Test | |||
| 2010 | 34.0% | 28.0% | 27.0% |
| 2009 | 36.0% | 26.0% | 26.0% |
| 2008 | 26.0% | 25.0% | 24.0% |
| CST Physics Test | |||
| 2010 | 68.0% | 55.0% | 49.0% |
| 2009 | 73.0% | 48.0% | 46.0% |
| 2008 | 74.0% | 45.0% | 43.0% |
| CST Summative High School Math Test | |||
| 2010 | 56.0% | 46.0% | 54.0% |
| 2009 | 51.0% | 41.0% | 50.0% |
| 2008 | 44.0% | 36.0% | 47.0% |
| CST World History Test | |||
| 2010 | 51.0% | 42.0% | 41.0% |
| 2009 | 49.0% | 37.0% | 38.0% |
| 2008 | 43.0% | 30.0% | 33.0% |
Source: CA Department of Education 2009-2010
School Map and Similar Schools Nearby
Click to Activate Map of Nearby School Campuses
Private
Public
This School
Similar Schools Nearby
| Citrus Hill High School 9-12 | 1,956 Students | 2.0 miles away | ![]() 4 out of 5 | |
| Moreno Valley High School 9-12 | 2,412 Students | 5.1 miles away | Not Yet Rated | |
| Polytechnic High School 9-12 | 2,883 Students | 5.2 miles away | ![]() 5 out of 5 | |
| Arlington High School 9-12 | 2,171 Students | 5.9 miles away | ![]() 4 out of 5 | |
| Ramona High School 9-12 | 2,094 Students | 6.0 miles away | ![]() 2.5 out of 5 | |
| Canyon Springs High School 9-12 | 2,584 Students | 6.6 miles away | ![]() 5 out of 5 | |
| John W. North High School 9-12 | 2,401 Students | 6.8 miles away | ![]() 5 out of 5 | |
| Riverside Virtual School KG-12 | 39 Students | 7.0 miles away | Not Yet Rated | - |
| Vista Del Lago High School 9-12 | 2,583 Students | 7.1 miles away | ![]() 5 out of 5 | |
| Rancho Verde High School 9-12 | 3,453 Students | 7.3 miles away | ![]() 3.5 out of 5 | |
Compare This School To Nearby Schools ->
School Community Forum

Join a discussion about Martin Luther King Jr. High School and talk to others in the community including students, parents, teachers, and administrators.
Popular Discussion Topics
- Admissions and Registration Questions (e.g. Dress Code and Discipline Policy)
- School Calendar and Upcoming Events (e.g. Graduation)
- After School Programs, Extracurricular Activities, and Athletics (e.g. Football)
- News and Announcements (e.g. Yearbook and Class Supply List Details)
- Graduate and Alumni Events (e.g. Organizing Class Reunions)
Navigation
Can't Find What You Are Looking For?
Rankings
Nearby Cities
Sponsored Links
K-12 Articles
The Very Best Things in the World
A recent poll in the U.K. revealed that children view the "very best thing in the world" as being...
Bullycide: What is It and How Can It Be Prevented?
Disclaimer: This article expresses my opinion that has been formed by personal experience and...
Summer Reading
In 1998, a book was published in the US that turned a hatred of reading to love. "Harry Potter and...


(5 / 5) 


