Casa Grande High School

No Reviews Yet
Find Old Friends From Casa Grande High School
Use the form below to search for alumni from Casa Grande High School.
School Description
School Summary and Highlights
- Enrolls 1,839 high school students from grades 9-12
- Ranks 207th out of 1,197 high schools in CA.
Additional Contact Information
- Mailing Address: 333 Casa Grande Rd., Petaluma, CA 94954
Faculty Details and Student Enrollment
Students and Faculty
- Total Students Enrolled: 1,839
- Total Full Time "Equivalent" Teachers: 83.2
- Average Student-To-Teacher Ratio: 22.1
Students Gender Breakdown
- Males: 904 (49.2%)
- Females: 935 (50.8%)
Free Lunch Student Eligibility Breakdown
- Eligible for Reduced Lunch: 99 (5.4%)
- Eligible for Free Lunch: 371 (20.2%)
- Eligible for Either Reduced or Free Lunch: 470 (25.6%)
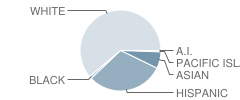
Student Enrollment Distribution by Race / Ethnicity

| Number | Percent | |
|---|---|---|
| American Indian | 7 | 0.4% |
| Black | 19 | 1.0% |
| Asian | 117 | 6.4% |
| Hispanic | 531 | 28.9% |
| White | 1,057 | 57.5% |
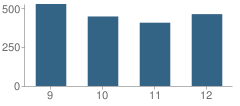
Number of Students Per Grade

| Number | Percent | |
|---|---|---|
| 9th Grade | 526 | 28.6% |
| 10th Grade | 446 | 24.3% |
| 11th Grade | 406 | 22.1% |
| 12th Grade | 461 | 25.1% |
Teacher Education Background (2009)
Percent With Ph.D.
School:
5.8%
District:
7.7%
Percent With Master's Degree
School:
19.2%
District:
26.9%
Percent With Bachelor's Degree: 6.7%
Teacher Credentials & Experience (2009)
Percent of Teachers With Emergency Credentials: 1.1%
Percent of Teachers With Credentials: 97.8%
Number of Certificated Staff: 104.0
Average Number of Years of Teacher Experience: 13.0
Average Age
School:
44.3
District:
53.4
Source: CA Department of Education, Source: NCES 2009-2010
School Ratings and Reviews
Be The First To Review Casa Grande High School!
Sponsored Links
Test Scores and Performance Information
Overall School Rating
How is this determined?
The overall school rating shows that Casa Grande High School performed on average better than many other schools across the state on CST state exams in the following subjects:
- CST Algebra I
- CST Algebra II
- CST Biology
- CST Chemistry
- CST Earth Science
- CST English-Language Arts
- CST General Mathematics
- CST Geometry
- CST Science
- CST Summative High School Math
- CST U.S. History
- CST World History
CST - Test Proficiency by Grade and Subject
Grade 9 - % of students at or above proficiency
| School | District | State | |
|---|---|---|---|
| CST Algebra I Test | |||
| 2010 | 38.0% | 30.0% | 22.0% |
| 2009 | 43.0% | 26.0% | 21.0% |
| 2008 | 34.0% | 28.0% | 18.0% |
| CST Algebra II Test | |||
| 2010 | 81.0% | 74.0% | 69.0% |
| 2009 | 50.0% | 48.0% | 65.0% |
| 2008 | 74.0% | 75.0% | 66.0% |
| CST Earth Science Test | |||
| 2010 | 59.0% | 60.0% | 35.0% |
| 2009 | 54.0% | 56.0% | 29.0% |
| 2008 | 53.0% | 57.0% | 31.0% |
| CST English-Language Arts Test | |||
| 2010 | 68.0% | 68.0% | 54.0% |
| 2009 | 67.0% | 66.0% | 50.0% |
| 2008 | 52.0% | 59.0% | 49.0% |
| CST General Mathematics Test | |||
| 2010 | 20.0% | 19.0% | 17.0% |
| 2009 | 19.0% | 19.0% | 17.0% |
| 2008 | 24.0% | 24.0% | 18.0% |
| CST Geometry Test | |||
| 2010 | 80.0% | 76.0% | 46.0% |
| 2009 | 90.0% | 80.0% | 47.0% |
| 2008 | 87.0% | 66.0% | 43.0% |
| CST World History Test | |||
| 2010 | 31.0% | 30.0% | 45.0% |
| 2009 | - | - | - |
| 2008 | 10.0% | 15.0% | 36.0% |
Grade 10 - % of students at or above proficiency
| School | District | State | |
|---|---|---|---|
| CST Algebra I Test | |||
| 2010 | 19.0% | 10.0% | 12.0% |
| 2009 | 13.0% | 11.0% | 11.0% |
| 2008 | 9.0% | 8.0% | 9.0% |
| CST Algebra II Test | |||
| 2010 | 40.0% | 44.0% | 40.0% |
| 2009 | 54.0% | 42.0% | 37.0% |
| 2008 | 29.0% | 36.0% | 36.0% |
| CST Biology Test | |||
| 2010 | 59.0% | 58.0% | 38.0% |
| 2009 | 51.0% | 54.0% | 34.0% |
| 2008 | 55.0% | 59.0% | 35.0% |
| CST Earth Science Test | |||
| 2010 | 17.0% | 22.0% | 29.0% |
| 2009 | 27.0% | 27.0% | 23.0% |
| 2008 | 7.0% | 10.0% | 23.0% |
| CST English-Language Arts Test | |||
| 2010 | 58.0% | 55.0% | 45.0% |
| 2009 | 53.0% | 52.0% | 44.0% |
| 2008 | 43.0% | 45.0% | 41.0% |
| CST Geometry Test | |||
| 2010 | 32.0% | 19.0% | 14.0% |
| 2009 | 33.0% | 24.0% | 14.0% |
| 2008 | 19.0% | 14.0% | 12.0% |
| CST Science Test | |||
| 2010 | 63.0% | 60.0% | 46.0% |
| 2009 | 59.0% | 58.0% | 44.0% |
| 2008 | 52.0% | 55.0% | 40.0% |
| CST Summative High School Math Test | |||
| 2010 | 68.0% | 67.0% | 75.0% |
| 2009 | 87.0% | 88.0% | 71.0% |
| 2008 | 76.0% | 76.0% | 68.0% |
| CST World History Test | |||
| 2010 | 52.0% | 47.0% | 42.0% |
| 2009 | 52.0% | 52.0% | 38.0% |
| 2008 | 40.0% | 42.0% | 33.0% |
Grade 11 - % of students at or above proficiency
| School | District | State | |
|---|---|---|---|
| CST Algebra I Test | |||
| 2010 | 13.0% | 12.0% | 8.0% |
| 2009 | 9.0% | 4.0% | 8.0% |
| 2008 | 11.0% | 5.0% | 5.0% |
| CST Algebra II Test | |||
| 2010 | 14.0% | 11.0% | 14.0% |
| 2009 | 13.0% | 10.0% | 12.0% |
| 2008 | 5.0% | 4.0% | 11.0% |
| CST Biology Test | |||
| 2010 | 37.0% | 35.0% | 46.0% |
| 2009 | 23.0% | 30.0% | 41.0% |
| 2008 | 33.0% | 37.0% | 39.0% |
| CST Chemistry Test | |||
| 2010 | 63.0% | 64.0% | 30.0% |
| 2009 | 58.0% | 62.0% | 27.0% |
| 2008 | 56.0% | 64.0% | 25.0% |
| CST English-Language Arts Test | |||
| 2010 | 55.0% | 55.0% | 42.0% |
| 2009 | 47.0% | 48.0% | 40.0% |
| 2008 | 42.0% | 43.0% | 37.0% |
| CST Geometry Test | |||
| 2010 | 14.0% | 12.0% | 6.0% |
| 2009 | 16.0% | 14.0% | 7.0% |
| 2008 | 8.0% | 7.0% | 6.0% |
| CST Summative High School Math Test | |||
| 2010 | 67.0% | 56.0% | 50.0% |
| 2009 | 63.0% | 47.0% | 47.0% |
| 2008 | 67.0% | 42.0% | 43.0% |
| CST U.S. History Test | |||
| 2010 | 47.0% | 50.0% | 45.0% |
| 2009 | 50.0% | 51.0% | 44.0% |
| 2008 | 41.0% | 43.0% | 38.0% |
| CST World History Test | |||
| 2010 | 25.0% | 24.0% | 15.0% |
| CST Earth Science Test | |||
| 2008 | 52.0% | 42.0% | 28.0% |
End of Course - % of students at or above proficiency
| School | District | State | |
|---|---|---|---|
| CST Algebra I Test | |||
| 2010 | 31.0% | 41.0% | 31.0% |
| 2009 | 30.0% | 37.0% | 28.0% |
| 2008 | 24.0% | 35.0% | 25.0% |
| CST Algebra II Test | |||
| 2010 | 31.0% | 30.0% | 31.0% |
| 2009 | 27.0% | 25.0% | 28.0% |
| 2008 | 18.0% | 22.0% | 27.0% |
| CST Biology Test | |||
| 2010 | 55.0% | 55.0% | 46.0% |
| 2009 | 45.0% | 48.0% | 42.0% |
| 2008 | 50.0% | 53.0% | 42.0% |
| CST Chemistry Test | |||
| 2010 | 63.0% | 65.0% | 38.0% |
| 2009 | 58.0% | 63.0% | 36.0% |
| 2008 | 56.0% | 64.0% | 32.0% |
| CST Earth Science Test | |||
| 2010 | 57.0% | 54.0% | 33.0% |
| 2009 | 52.0% | 50.0% | 28.0% |
| 2008 | 50.0% | 53.0% | 28.0% |
| CST General Mathematics Test | |||
| 2010 | 20.0% | 37.0% | 27.0% |
| 2009 | 19.0% | 35.0% | 26.0% |
| 2008 | 24.0% | 39.0% | 27.0% |
| CST Geometry Test | |||
| 2010 | 45.0% | 41.0% | 27.0% |
| 2009 | 43.0% | 41.0% | 26.0% |
| 2008 | 31.0% | 28.0% | 24.0% |
| CST Summative High School Math Test | |||
| 2010 | 67.0% | 58.0% | 54.0% |
| 2009 | 68.0% | 51.0% | 50.0% |
| 2008 | 69.0% | 48.0% | 47.0% |
| CST World History Test | |||
| 2010 | 51.0% | 45.0% | 41.0% |
| 2009 | 50.0% | 50.0% | 38.0% |
| 2008 | 39.0% | 42.0% | 33.0% |
Source: CA Department of Education 2009-2010
School Map and Similar Schools Nearby
Click to Activate Map of Nearby School Campuses
Private
Public
This School
Similar Schools Nearby
| Petaluma High School 9-12 | 1,365 Students | 2.5 miles away | Not Yet Rated | |
| Petaluma Junior High School 7-8 | 646 Students | 3.1 miles away | ![]() 5 out of 5 | |
| Kenilworth Junior High School 7-8 | 1,012 Students | 3.3 miles away | ![]() 5 out of 5 | |
| San Marin High School 9-12 | 950 Students | 8.1 miles away | ![]() 5 out of 5 | |
| Rancho Cotate High School 9-12 | 1,549 Students | 8.5 miles away | ![]() 4 out of 5 | |
| Novato High School 9-12 | 1,322 Students | 10.4 miles away | ![]() 5 out of 5 | |
| Tomales High School 9-12 | 183 Students | 16.0 miles away | Not Yet Rated | |
| Terra Linda High School 9-12 | 1,112 Students | 16.7 miles away | Not Yet Rated | |
| Sir Francis Drake High School 9-12 | 1,049 Students | 17.6 miles away | Not Yet Rated | |
Compare This School To Nearby Schools ->
School Community Forum

Join a discussion about Casa Grande High School and talk to others in the community including students, parents, teachers, and administrators.
Popular Discussion Topics
- Admissions and Registration Questions (e.g. Dress Code and Discipline Policy)
- School Calendar and Upcoming Events (e.g. Graduation)
- After School Programs, Extracurricular Activities, and Athletics (e.g. Football)
- News and Announcements (e.g. Yearbook and Class Supply List Details)
- Graduate and Alumni Events (e.g. Organizing Class Reunions)
Navigation
Can't Find What You Are Looking For?
Rankings
Nearby Cities
Sponsored Links
K-12 Articles
Tips for Easing Your Child's Back to School Stress
Do you remember the roller coaster of emotions that you experienced as a child when the day for...
Teach Your Child to Write Well
When American children head off to junior kindergarten, they must be ready to learn. It is your...
Homework Tips: Taking the Work out of Homework
Kids hate homework. It seems that almost every night of the week they are overloaded with...


