Hoover High School

No Reviews Yet
Find Old Friends From Hoover High School
Use the form below to search for alumni from Hoover High School.
School Description
School Summary and Highlights
- Enrolls 2,163 high school students from grades 9-12
- Ranks 1066th out of 1,197 high schools in CA.
- 2010 Overall School AYP Met Status: No
Additional Contact Information
- Mailing Address: 4474 El Cajon Blvd., San Diego, CA 92115
School Operational Details
- Title I EligibleAll students of this school are eligible for participation in authorized programs.
School District Details
- San Diego Unified School District
- Per-Pupil Spending: $10,305
- Graduation Rate: 63.0%
- Dropout Rate: 2.4%
- Students Per Teacher: 20.1
- Enrolled Students: 131,163
Faculty Details and Student Enrollment
Students and Faculty
- Total Students Enrolled: 2,163
- Total Full Time "Equivalent" Teachers: 101.0
- Average Student-To-Teacher Ratio: 21.4
Students Gender Breakdown
- Males: 1,154 (53.4%)
- Females: 1,009 (46.6%)
Free Lunch Student Eligibility Breakdown
- Eligible for Reduced Lunch: 81 (3.7%)
- Eligible for Free Lunch: 2,001 (92.5%)
- Eligible for Either Reduced or Free Lunch: 2,082 (96.3%)
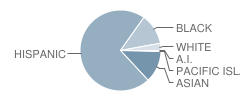
Student Enrollment Distribution by Race / Ethnicity

| Number | Percent | |
|---|---|---|
| American Indian | 3 | 0.1% |
| Black | 267 | 12.3% |
| Asian | 274 | 12.7% |
| Hispanic | 1,544 | 71.4% |
| White | 62 | 2.9% |
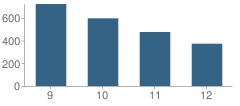
Number of Students Per Grade

| Number | Percent | |
|---|---|---|
| 9th Grade | 721 | 33.3% |
| 10th Grade | 595 | 27.5% |
| 11th Grade | 475 | 22.0% |
| 12th Grade | 372 | 17.2% |
Graduates Information (2010)
Graduation Rate
School:
68.1%
District:
79.3%
State:
78.6%
Teacher Education Background (2009)
Percent With Ph.D.
School:
2.5%
District:
2.0%
Percent With Master's Degree
School:
60.5%
District:
80.1%
Percent With Bachelor's Degree
School:
34.5%
District:
16.8%
Teacher Credentials & Experience (2009)
Percent of Teachers With Credentials: 96.2%
Number of Certificated Staff: 119.0
Average Number of Years of Teacher Experience: 13.4
Average Age
School:
44.0
District:
46.6
Source: CA Department of Education, Source: NCES 2009-2010
School Ratings and Reviews
Be The First To Review Hoover High School!
Sponsored Links
Test Scores and Performance Information
Overall School Rating
How is this determined?
The overall school rating shows that Hoover High School performed on average worse than many other schools across the state on CST state exams in the following subjects:
- CST Algebra I
- CST Algebra II
- CST Biology
- CST Chemistry
- CST Earth Science
- CST English-Language Arts
- CST General Mathematics
- CST Geometry
- CST Integrated Math 1
- CST Physics
- CST Science
- CST Summative High School Math
- CST U.S. History
- CST World History
AYP Results (2010)
Overall AYP Met: No
ELA AYP Met: No
Math AYP Met: No
Program Improvement (PI) Requirement Under NCLB (2010)
First Year PI Requirement was Implemented: 1997-1998
School's Placement Under NCLB: Year 5
ACT Exam Results (2009)
Percent of Students Taking ACT Exam: 19.0%
Average Combined Score: 17.0
Percent Scoring At or Above 21: 10.5%
SAT Exam Results (2009)
Percent of Students Taking SAT Exam: 38.8%
Average Combined Score: 1,202.0
Critical Reading Average: 393.9
Math Average: 408.3
Writing Average: 399.9
Percent Scoring At or Above 1500: 9.0%
CST - Test Proficiency by Grade and Subject
Grade 9 - % of students at or above proficiency
| School | District | State | |
|---|---|---|---|
| CST Algebra I Test | |||
| 2010 | 14.0% | 15.0% | 22.0% |
| 2009 | 3.0% | 13.0% | 21.0% |
| 2008 | 3.0% | 8.0% | 18.0% |
| CST Algebra II Test | |||
| 2010 | 58.0% | 59.0% | 69.0% |
| CST Biology Test | |||
| 2010 | 36.0% | 58.0% | 55.0% |
| 2009 | 37.0% | 55.0% | 51.0% |
| 2008 | 59.0% | 59.0% | 52.0% |
| CST Earth Science Test | |||
| 2010 | 23.0% | 31.0% | 35.0% |
| 2009 | 12.0% | 23.0% | 29.0% |
| 2008 | 13.0% | 21.0% | 31.0% |
| CST English-Language Arts Test | |||
| 2010 | 29.0% | 58.0% | 54.0% |
| 2009 | 30.0% | 52.0% | 50.0% |
| 2008 | 30.0% | 50.0% | 49.0% |
| CST General Mathematics Test | |||
| 2010 | 10.0% | 6.0% | 17.0% |
| 2009 | 7.0% | 3.0% | 17.0% |
| CST Geometry Test | |||
| 2010 | 10.0% | 29.0% | 46.0% |
| 2009 | 7.0% | 28.0% | 47.0% |
| 2008 | 9.0% | 26.0% | 43.0% |
| CST Physics Test | |||
| 2010 | 22.0% | 49.0% | 40.0% |
| 2009 | 9.0% | 36.0% | 35.0% |
| 2008 | 8.0% | 31.0% | 30.0% |
| CST World History Test | |||
| 2009 | 7.0% | 59.0% | 41.0% |
| 2008 | 9.0% | 57.0% | 36.0% |
Grade 10 - % of students at or above proficiency
| School | District | State | |
|---|---|---|---|
| CST Algebra I Test | |||
| 2010 | 9.0% | 9.0% | 12.0% |
| 2009 | 4.0% | 9.0% | 11.0% |
| 2008 | 2.0% | 5.0% | 9.0% |
| CST Algebra II Test | |||
| 2010 | 16.0% | 25.0% | 40.0% |
| 2009 | 13.0% | 22.0% | 37.0% |
| 2008 | 11.0% | 20.0% | 36.0% |
| CST Biology Test | |||
| 2010 | 15.0% | 37.0% | 38.0% |
| 2009 | 10.0% | 33.0% | 34.0% |
| 2008 | 12.0% | 31.0% | 35.0% |
| CST Chemistry Test | |||
| 2010 | 13.0% | 48.0% | 47.0% |
| 2009 | 10.0% | 36.0% | 44.0% |
| 2008 | 7.0% | 31.0% | 41.0% |
| CST Earth Science Test | |||
| 2010 | 18.0% | 19.0% | 29.0% |
| 2009 | 4.0% | 18.0% | 23.0% |
| 2008 | 16.0% | 15.0% | 23.0% |
| CST English-Language Arts Test | |||
| 2010 | 27.0% | 48.0% | 45.0% |
| 2009 | 23.0% | 44.0% | 44.0% |
| 2008 | 19.0% | 40.0% | 41.0% |
| CST Geometry Test | |||
| 2010 | 5.0% | 7.0% | 14.0% |
| 2009 | 1.0% | 7.0% | 14.0% |
| CST Physics Test | |||
| 2010 | 25.0% | 35.0% | 44.0% |
| 2009 | 6.0% | 23.0% | 40.0% |
| 2008 | 18.0% | 24.0% | 36.0% |
| CST Science Test | |||
| 2010 | 20.0% | 44.0% | 46.0% |
| 2009 | 15.0% | 40.0% | 44.0% |
| 2008 | 13.0% | 32.0% | 40.0% |
| CST World History Test | |||
| 2010 | 18.0% | 39.0% | 42.0% |
| 2009 | 16.0% | 35.0% | 38.0% |
| 2008 | 13.0% | 29.0% | 33.0% |
| CST Summative High School Math Test | |||
| 2008 | 31.0% | 60.0% | 68.0% |
Grade 11 - % of students at or above proficiency
| School | District | State | |
|---|---|---|---|
| CST Algebra I Test | |||
| 2010 | 5.0% | 6.0% | 8.0% |
| 2009 | 11.0% | 4.0% | 8.0% |
| 2008 | 9.0% | 3.0% | 5.0% |
| CST Algebra II Test | |||
| 2010 | 7.0% | 6.0% | 14.0% |
| 2009 | 1.0% | 4.0% | 12.0% |
| 2008 | 2.0% | 3.0% | 11.0% |
| CST Biology Test | |||
| 2010 | 25.0% | 58.0% | 46.0% |
| 2009 | 9.0% | 50.0% | 41.0% |
| 2008 | 24.0% | 43.0% | 39.0% |
| CST Chemistry Test | |||
| 2010 | 6.0% | 20.0% | 30.0% |
| 2009 | 6.0% | 14.0% | 27.0% |
| 2008 | 3.0% | 15.0% | 25.0% |
| CST Earth Science Test | |||
| 2010 | 7.0% | 37.0% | 32.0% |
| 2009 | 10.0% | 25.0% | 26.0% |
| CST English-Language Arts Test | |||
| 2010 | 24.0% | 45.0% | 42.0% |
| 2009 | 21.0% | 41.0% | 40.0% |
| 2008 | 17.0% | 38.0% | 37.0% |
| CST Geometry Test | |||
| 2010 | 3.0% | 4.0% | 6.0% |
| 2009 | 1.0% | 2.0% | 7.0% |
| 2008 | 3.0% | 2.0% | 6.0% |
| CST Integrated Math 1 Test | |||
| 2010 | 3.0% | 9.0% | 11.0% |
| CST Physics Test | |||
| 2010 | 33.0% | 26.0% | 53.0% |
| 2009 | 25.0% | 31.0% | 50.0% |
| 2008 | 12.0% | 30.0% | 47.0% |
| CST Summative High School Math Test | |||
| 2010 | 25.0% | 35.0% | 50.0% |
| 2009 | 23.0% | 32.0% | 47.0% |
| 2008 | 13.0% | 30.0% | 43.0% |
| CST U.S. History Test | |||
| 2010 | 20.0% | 47.0% | 45.0% |
| 2009 | 26.0% | 44.0% | 44.0% |
| 2008 | 21.0% | 36.0% | 38.0% |
| CST World History Test | |||
| 2010 | 3.0% | 10.0% | 15.0% |
| 2009 | 28.0% | 12.0% | 11.0% |
| 2008 | 11.0% | 12.0% | 9.0% |
End of Course - % of students at or above proficiency
| School | District | State | |
|---|---|---|---|
| CST Algebra I Test | |||
| 2010 | 13.0% | 34.0% | 31.0% |
| 2009 | 3.0% | 30.0% | 28.0% |
| 2008 | 3.0% | 25.0% | 25.0% |
| CST Algebra II Test | |||
| 2010 | 14.0% | 22.0% | 31.0% |
| 2009 | 8.0% | 19.0% | 28.0% |
| 2008 | 6.0% | 17.0% | 27.0% |
| CST Biology Test | |||
| 2010 | 18.0% | 44.0% | 46.0% |
| 2009 | 12.0% | 40.0% | 42.0% |
| 2008 | 21.0% | 38.0% | 42.0% |
| CST Chemistry Test | |||
| 2010 | 7.0% | 29.0% | 38.0% |
| 2009 | 7.0% | 23.0% | 36.0% |
| 2008 | 5.0% | 26.0% | 32.0% |
| CST Earth Science Test | |||
| 2010 | 22.0% | 31.0% | 33.0% |
| 2009 | 11.0% | 23.0% | 28.0% |
| 2008 | 13.0% | 21.0% | 28.0% |
| CST General Mathematics Test | |||
| 2010 | 10.0% | 22.0% | 27.0% |
| 2009 | 7.0% | 15.0% | 26.0% |
| CST Geometry Test | |||
| 2010 | 7.0% | 22.0% | 27.0% |
| 2009 | 4.0% | 21.0% | 26.0% |
| 2008 | 4.0% | 17.0% | 24.0% |
| CST Integrated Math 1 Test | |||
| 2010 | 3.0% | 10.0% | 13.0% |
| CST Physics Test | |||
| 2010 | 25.0% | 44.0% | 49.0% |
| 2009 | 12.0% | 34.0% | 46.0% |
| 2008 | 11.0% | 31.0% | 43.0% |
| CST Summative High School Math Test | |||
| 2010 | 25.0% | 39.0% | 54.0% |
| 2009 | 26.0% | 37.0% | 50.0% |
| 2008 | 16.0% | 34.0% | 47.0% |
| CST World History Test | |||
| 2010 | 16.0% | 41.0% | 41.0% |
| 2009 | 16.0% | 38.0% | 38.0% |
| 2008 | 13.0% | 31.0% | 33.0% |
Source: CA Department of Education 2009-2010
School Map and Similar Schools Nearby
Click to Activate Map of Nearby School Campuses
Private
Public
This School
Similar Schools Nearby
| Invention and Design Educational Academy 9-12 | 331 Students | 1.3 miles away | Not Yet Rated | |
| Lincoln High School 9-12 | 2,161 Students | 3.7 miles away | Not Yet Rated | - |
| Henry High School 9-12 | 2,466 Students | 3.9 miles away | Not Yet Rated | |
| Scitech High School 9-12 | 554 Students | 4.2 miles away | Not Yet Rated | |
| Morse High School 9-12 | 2,339 Students | 4.7 miles away | Not Yet Rated | |
| School of International Business at Kearny High Education 9-12 | 454 Students | 4.7 miles away | Not Yet Rated | |
| Serra High School 9-12 | 2,087 Students | 4.8 miles away | Not Yet Rated | |
| Bell Junior High School 6-8 | 1,075 Students | 5.8 miles away | Not Yet Rated | |
| San Diego School of Creative and Performing Art 6-12 | 1,427 Students | 6.1 miles away | Not Yet Rated | |
| Coronado High School 9-12 | 1,120 Students | 6.5 miles away | Not Yet Rated | |
Compare This School To Nearby Schools ->
School Community Forum

Join a discussion about Hoover High School and talk to others in the community including students, parents, teachers, and administrators.
Popular Discussion Topics
- Admissions and Registration Questions (e.g. Dress Code and Discipline Policy)
- School Calendar and Upcoming Events (e.g. Graduation)
- After School Programs, Extracurricular Activities, and Athletics (e.g. Football)
- News and Announcements (e.g. Yearbook and Class Supply List Details)
- Graduate and Alumni Events (e.g. Organizing Class Reunions)
Navigation
Can't Find What You Are Looking For?
Rankings
Nearby Cities
Sponsored Links
K-12 Articles
Teaching Your Kids About Respect, Values and Violence
These days it seems that every newscast reports at least once incident of violence. As parents, we...
Preparing Your Child for the First Day of School
It seems like school was just dismissed for the summer, yet here we are facing another year of back...
The Most Used Form of Communication
Writing has, quite surprisingly, become more and more important in today's electronic society....
