Sequoia Elementary School
Rating
Not Available
Not Available

No Reviews Yet
Find Old Friends From Sequoia Elementary School
Use the form below to search for alumni from Sequoia Elementary School.
School Description
School Summary and Highlights
- Enrolls 251 elementary school students from grades KG-6
- Ranks 2204th out of 5,423 elementary schools in CA.
- 2010 Overall School AYP Met Status: Yes
Additional Contact Information
- Mailing Address: 4690 Limerick Ave., San Diego, CA 92117
School Operational Details
- Title I EligibleAll students of this school are eligible for participation in authorized programs.
School District Details
- San Diego Unified School District
- Per-Pupil Spending: $10,305
- Graduation Rate: 63.0%
- Dropout Rate: 2.4%
- Students Per Teacher: 20.1
- Enrolled Students: 131,163
Faculty Details and Student Enrollment
Students and Faculty
- Total Students Enrolled: 251
- Total Full Time "Equivalent" Teachers: 13.0
- Average Student-To-Teacher Ratio: 19.3
Students Gender Breakdown
- Males: 127 (50.6%)
- Females: 124 (49.4%)
Free Lunch Student Eligibility Breakdown
- Eligible for Reduced Lunch: 31 (12.4%)
- Eligible for Free Lunch: 146 (58.2%)
- Eligible for Either Reduced or Free Lunch: 177 (70.5%)
Student Enrollment Distribution by Race / Ethnicity
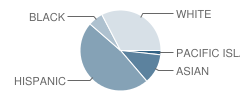
| Number | Percent | |
|---|---|---|
| American Indian | - | - |
| Black | 14 | 5.6% |
| Asian | 28 | 11.2% |
| Hispanic | 111 | 44.2% |
| White | 76 | 30.3% |
Number of Students Per Grade
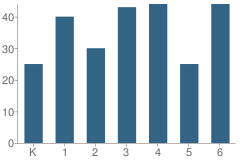
| Number | Percent | |
|---|---|---|
| Kindergarten | 25 | 10.0% |
| 1st Grade | 40 | 15.9% |
| 2nd Grade | 30 | 12.0% |
| 3rd Grade | 43 | 17.1% |
| 4th Grade | 44 | 17.5% |
| 5th Grade | 25 | 10.0% |
| 6th Grade | 44 | 17.5% |
Teacher Education Background (2009)
Percent With Ph.D.
School:
6.3%
District:
2.0%
Percent With Master's Degree
School:
68.8%
District:
80.1%
Percent With Bachelor's Degree
School:
25.0%
District:
16.8%
Teacher Credentials & Experience (2009)
Percent of Teachers With Credentials: 100.0%
Number of Certificated Staff: 16.0
Average Number of Years of Teacher Experience: 20.0
Average Age
School:
48.1
District:
46.6
Source: CA Department of Education, Source: NCES 2009-2010
School Ratings and Reviews
Be The First To Review Sequoia Elementary School!
School Map and Similar Schools Nearby
Click to Activate Map of Nearby School Campuses
Private
Public
This School
Similar Schools Nearby
| Lafayette Elementary School KG-6 | 316 Students | 0.6 miles away | Not Yet Rated | |
| Lindbergh / Schweitzer Elementary School KG-6 | 610 Students | 0.8 miles away | Not Yet Rated | |
| John Muir School KG-12 | 380 Students | 0.9 miles away | Not Yet Rated | |
| Hawthorne Elementary School KG-6 | 325 Students | 0.9 miles away | Not Yet Rated | |
| Field Elementary School KG-6 | 294 Students | 1.1 miles away | Not Yet Rated | |
| Holmes Elementary School KG-6 | 492 Students | 1.3 miles away | Not Yet Rated | |
| Whitman Elementary School KG-6 | 336 Students | 1.5 miles away | Not Yet Rated | |
| Ross Elementary School KG-5 | 380 Students | 1.5 miles away | Not Yet Rated | |
| Cadman Elementary School KG-5 | 166 Students | 2.1 miles away | Not Yet Rated | |
| Curie Elementary School KG-5 | 592 Students | 2.4 miles away | Not Yet Rated | |
Compare This School To Nearby Schools ->
School Community Forum

Join a discussion about Sequoia Elementary School and talk to others in the community including students, parents, teachers, and administrators.
Popular Discussion Topics
- Admissions and Registration Questions (e.g. Dress Code and Discipline Policy)
- School Calendar and Upcoming Events (e.g. Graduation)
- After School Programs, Extracurricular Activities, and Athletics (e.g. Football)
- News and Announcements (e.g. Yearbook and Class Supply List Details)
- Graduate and Alumni Events (e.g. Organizing Class Reunions)
Navigation
Can't Find What You Are Looking For?
Rankings
Nearby Cities
Sponsored Links
K-12 Articles

Those Pesky Little Transitions
Transitions are rarely easy, yet we have to encounter them every day of our lives. For school-aged...
Transitions are rarely easy, yet we have to encounter them every day of our lives. For school-aged...

Parent and Family Involvement in School
When visiting my grandson’s school, I often hear administrators and teachers complaining that not...
When visiting my grandson’s school, I often hear administrators and teachers complaining that not...

The Pros and Cons of Seat Belts in School Buses
Recently the news has been full of school bus accidents where children have been seriously injured...
Recently the news has been full of school bus accidents where children have been seriously injured...