Monte Vista High School
Rating
Not Available
Not Available

4 out of 5 | 2 Reviews
Find Old Friends From Monte Vista High School
Use the form below to search for alumni from Monte Vista High School.
School Description
School Summary and Highlights
- Enrolls 2,195 high school students from grades 9-12
- Ranks 52nd out of 1,197 high schools in CA.
- 2010 Overall School AYP Met Status: Yes
Additional Contact Information
- Mailing Address: 3131 Stone Valley Rd., Danville, CA 94526
School District Details
- San Ramon Valley Unified School District
- Per-Pupil Spending: $8,434
- Graduation Rate: 100.0%
- Dropout Rate: 0.8%
- Students Per Teacher: 22.1
- Enrolled Students: 24,257
Faculty Details and Student Enrollment
Students and Faculty
- Total Students Enrolled: 2,195
- Total Full Time "Equivalent" Teachers: 93.8
- Average Student-To-Teacher Ratio: 23.4
Students Gender Breakdown
- Males: 1,119 (51.0%)
- Females: 1,076 (49.0%)
Free Lunch Student Eligibility Breakdown
- Eligible for Reduced Lunch: 6 (0.3%)
- Eligible for Free Lunch: 10 (0.5%)
- Eligible for Either Reduced or Free Lunch: 16 (0.7%)
Student Enrollment Distribution by Race / Ethnicity
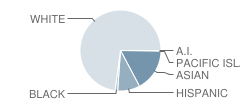
| Number | Percent | |
|---|---|---|
| American Indian | 4 | 0.2% |
| Black | 23 | 1.0% |
| Asian | 346 | 15.8% |
| Hispanic | 182 | 8.3% |
| White | 1,481 | 67.5% |
Number of Students Per Grade
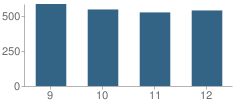
| Number | Percent | |
|---|---|---|
| 9th Grade | 585 | 26.7% |
| 10th Grade | 546 | 24.9% |
| 11th Grade | 525 | 23.9% |
| 12th Grade | 539 | 24.6% |
Graduates Information (2010)
Graduation Rate
School:
98.5%
District:
97.2%
State:
78.6%
Teacher Education Background (2009)
Percent With Ph.D.
School:
1.7%
District:
4.1%
Percent With Master's Degree
School:
24.4%
District:
39.0%
Percent With Bachelor's Degree
School:
36.1%
District:
19.5%
Teacher Credentials & Experience (2009)
Percent of Teachers With Emergency Credentials: 1.9%
Percent of Teachers With Credentials: 96.2%
Number of Certificated Staff: 119.0
Average Number of Years of Teacher Experience: 12.2
Average Age
School:
42.4
District:
46.3
Source: CA Department of Education, Source: NCES 2009-2010
School Ratings and Reviews
Overall Rating: 4

4 out of 5 | 2 Reviews
The Overall Rating is the school's average rating from parents, students, school faculty and staff. The highest rating is five apples and the lowest is one apple.
Share Your Review About This School
2 reviews for Monte Vista High School
- Reviewed by Parent/Guardian on September 30, 2009
- Rating:
 (3 / 5) Flag as inappropriate
 - Academically it is ok, but the drugs and cliques are terrible. Kids come to school stoned and teachers look the other way. It is easier to buy drugs there than lunch. Something needs to be done! Kids are having relations on the dance floor at dances and come there high also.
- Reviewed by Student on April 25, 2007
- Rating:
 (5 / 5) Flag as inappropriate
 - Monte Vista is the best. basically, we are amazing....you know it. so....thats it. we're just THAT cool!
MV! GO MUSTANGS!
School Map and Similar Schools Nearby
Click to Activate Map of Nearby School Campuses
Private
Public
This School
Similar Schools Nearby
| San Ramon Valley High School 9-12 | 2,039 Students | 1.9 miles away | Not Yet Rated | |
| Northgate High School 9-12 | 1,476 Students | 4.8 miles away | Not Yet Rated | |
| Las Lomas High School 9-12 | 1,454 Students | 5.1 miles away | Not Yet Rated | |
| Ygnacio Valley High School 9-12 | 1,343 Students | 6.7 miles away |  5 out of 5 | |
| California High School 9-12 | 2,431 Students | 7.0 miles away | Not Yet Rated | |
| Clayton Valley High School 9-12 | 1,868 Students | 7.4 miles away | Not Yet Rated | |
| Acalanes High School 9-12 | 1,371 Students | 7.5 miles away | Not Yet Rated | |
| Campolindo High School 9-12 | 1,409 Students | 7.9 miles away | Not Yet Rated | |
| Miramonte High School 9-12 | 1,280 Students | 9.0 miles away | Not Yet Rated | |
| Dublin High School 9-12 | 493 Students | 9.1 miles away | 5 out of 5 | |
Compare This School To Nearby Schools ->
School Community Forum

Join a discussion about Monte Vista High School and talk to others in the community including students, parents, teachers, and administrators.
Popular Discussion Topics
- Admissions and Registration Questions (e.g. Dress Code and Discipline Policy)
- School Calendar and Upcoming Events (e.g. Graduation)
- After School Programs, Extracurricular Activities, and Athletics (e.g. Football)
- News and Announcements (e.g. Yearbook and Class Supply List Details)
- Graduate and Alumni Events (e.g. Organizing Class Reunions)
Navigation
Can't Find What You Are Looking For?
Rankings
Nearby Cities
Sponsored Links
K-12 Articles

Teaching Children a Love of History
Parents and grandparents are responsible for teaching children a love of history. To begin, relate...
Parents and grandparents are responsible for teaching children a love of history. To begin, relate...

Keeping Our Kids Safe in the Post 9/11 World
Recently, radio talk show host and CNN personality did a week-long special entitled "The Perfect...
Recently, radio talk show host and CNN personality did a week-long special entitled "The Perfect...

Simple Math ... a Simple Gift
Math affects every aspect of our lives-from balancing the checkbook to estimating the amount of...
Math affects every aspect of our lives-from balancing the checkbook to estimating the amount of...