Ygnacio Valley High School

5 out of 5 | 1 Review
Find Old Friends From Ygnacio Valley High School
Use the form below to search for alumni from Ygnacio Valley High School.
School Description
School Summary and Highlights
- Enrolls 1,343 high school students from grades 9-12
- Ranks 918th out of 1,197 high schools in CA.
- 2010 Overall School AYP Met Status: No
Additional Contact Information
- Mailing Address: 755 Oak Grove Rd., Concord, CA 94518
School District Details
- Mt. Diablo Unified School District
- Per-Pupil Spending: $8,861
- Graduation Rate: 76.8%
- Dropout Rate: 6.2%
- Students Per Teacher: 22.7
- Enrolled Students: 34,154
Faculty Details and Student Enrollment
Students and Faculty
- Total Students Enrolled: 1,343
- Total Full Time "Equivalent" Teachers: 64.0
- Average Student-To-Teacher Ratio: 21.0
Students Gender Breakdown
- Males: 677 (50.4%)
- Females: 666 (49.6%)
Free Lunch Student Eligibility Breakdown
- Eligible for Reduced Lunch: 100 (7.4%)
- Eligible for Free Lunch: 526 (39.2%)
- Eligible for Either Reduced or Free Lunch: 626 (46.6%)
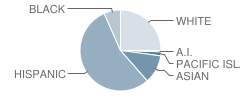
Student Enrollment Distribution by Race / Ethnicity

| Number | Percent | |
|---|---|---|
| American Indian | 11 | 0.8% |
| Black | 91 | 6.8% |
| Asian | 154 | 11.5% |
| Hispanic | 729 | 54.3% |
| White | 334 | 24.9% |
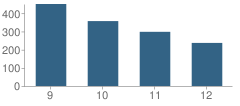
Number of Students Per Grade

| Number | Percent | |
|---|---|---|
| 9th Grade | 451 | 33.6% |
| 10th Grade | 357 | 26.6% |
| 11th Grade | 298 | 22.2% |
| 12th Grade | 237 | 17.6% |
Graduates Information (2010)
Graduation Rate
School:
75.2%
District:
79.5%
State:
78.6%
Teacher Education Background (2009)
Percent With Ph.D.
School:
2.4%
District:
4.0%
Percent With Master's Degree
School:
29.3%
District:
61.7%
Teacher Credentials & Experience (2009)
Percent of Teachers With Emergency Credentials: 1.3%
Percent of Teachers With Credentials: 92.0%
Number of Certificated Staff: 82.0
Average Number of Years of Teacher Experience: 9.6
Average Age
School:
41.9
District:
48.8
Source: CA Department of Education, Source: NCES 2009-2010
Sponsored Links
Test Scores and Performance Information
Overall School Rating
How is this determined?
The overall school rating shows that Ygnacio Valley High School performed on average worse than many other schools across the state on CST state exams in the following subjects:
- CST Algebra I
- CST Algebra II
- CST Biology
- CST Chemistry
- CST Earth Science
- CST English-Language Arts
- CST General Mathematics
- CST Geometry
- CST Science
- CST Summative High School Math
- CST U.S. History
- CST World History
AYP Results (2010)
Overall AYP Met: No
ELA AYP Met: No
Math AYP Met: No
ACT Exam Results (2009)
Percent of Students Taking ACT Exam: 14.1%
Average Combined Score: 21.7
Percent Scoring At or Above 21: 52.5%
SAT Exam Results (2009)
Percent of Students Taking SAT Exam: 31.0%
Average Combined Score: 1,458.8
Critical Reading Average: 479.0
Math Average: 497.5
Writing Average: 482.3
Percent Scoring At or Above 1500: 39.8%
CST - Test Proficiency by Grade and Subject
Grade 9 - % of students at or above proficiency
| School | District | State | |
|---|---|---|---|
| CST Algebra I Test | |||
| 2010 | 21.0% | 20.0% | 22.0% |
| 2009 | 21.0% | 23.0% | 21.0% |
| 2008 | 16.0% | 20.0% | 18.0% |
| CST Algebra II Test | |||
| 2010 | 18.0% | 47.0% | 69.0% |
| CST Biology Test | |||
| 2010 | 39.0% | 58.0% | 55.0% |
| 2009 | 33.0% | 51.0% | 51.0% |
| 2008 | 70.0% | 62.0% | 52.0% |
| CST Earth Science Test | |||
| 2010 | 19.0% | 19.0% | 35.0% |
| 2009 | 10.0% | 14.0% | 29.0% |
| 2008 | 15.0% | 16.0% | 31.0% |
| CST English-Language Arts Test | |||
| 2010 | 37.0% | 56.0% | 54.0% |
| 2009 | 27.0% | 54.0% | 50.0% |
| 2008 | 36.0% | 53.0% | 49.0% |
| CST General Mathematics Test | |||
| 2010 | 8.0% | 13.0% | 17.0% |
| 2009 | 9.0% | 18.0% | 17.0% |
| 2008 | 8.0% | 18.0% | 18.0% |
| CST Geometry Test | |||
| 2010 | 22.0% | 54.0% | 46.0% |
| 2009 | 19.0% | 53.0% | 47.0% |
| 2008 | 45.0% | 55.0% | 43.0% |
| CST World History Test | |||
| 2010 | 11.0% | 19.0% | 45.0% |
| 2009 | 13.0% | 17.0% | 41.0% |
Grade 10 - % of students at or above proficiency
| School | District | State | |
|---|---|---|---|
| CST Algebra I Test | |||
| 2010 | 3.0% | 7.0% | 12.0% |
| 2009 | 1.0% | 6.0% | 11.0% |
| 2008 | 2.0% | 6.0% | 9.0% |
| CST Algebra II Test | |||
| 2010 | 28.0% | 45.0% | 40.0% |
| 2009 | 32.0% | 38.0% | 37.0% |
| 2008 | 20.0% | 37.0% | 36.0% |
| CST Biology Test | |||
| 2010 | 22.0% | 40.0% | 38.0% |
| 2009 | 30.0% | 38.0% | 34.0% |
| 2008 | 21.0% | 33.0% | 35.0% |
| CST Chemistry Test | |||
| 2010 | 29.0% | 39.0% | 47.0% |
| 2009 | 52.0% | 44.0% | 44.0% |
| 2008 | 45.0% | 34.0% | 41.0% |
| CST Earth Science Test | |||
| 2010 | 10.0% | 35.0% | 29.0% |
| CST English-Language Arts Test | |||
| 2010 | 30.0% | 50.0% | 45.0% |
| 2009 | 37.0% | 49.0% | 44.0% |
| 2008 | 36.0% | 47.0% | 41.0% |
| CST Geometry Test | |||
| 2010 | 7.0% | 18.0% | 14.0% |
| 2009 | 7.0% | 20.0% | 14.0% |
| 2008 | 6.0% | 17.0% | 12.0% |
| CST Science Test | |||
| 2010 | 36.0% | 51.0% | 46.0% |
| 2009 | 41.0% | 54.0% | 44.0% |
| 2008 | 37.0% | 46.0% | 40.0% |
| CST World History Test | |||
| 2010 | 37.0% | 47.0% | 42.0% |
| 2009 | 39.0% | 47.0% | 38.0% |
| 2008 | 31.0% | 38.0% | 33.0% |
Grade 11 - % of students at or above proficiency
| School | District | State | |
|---|---|---|---|
| CST Algebra II Test | |||
| 2010 | 6.0% | 10.0% | 14.0% |
| 2009 | 8.0% | 10.0% | 12.0% |
| 2008 | 1.0% | 7.0% | 11.0% |
| CST Biology Test | |||
| 2010 | 64.0% | 64.0% | 46.0% |
| 2009 | 55.0% | 60.0% | 41.0% |
| 2008 | 40.0% | 53.0% | 39.0% |
| CST Chemistry Test | |||
| 2010 | 8.0% | 22.0% | 30.0% |
| 2009 | 13.0% | 22.0% | 27.0% |
| 2008 | 10.0% | 19.0% | 25.0% |
| CST English-Language Arts Test | |||
| 2010 | 37.0% | 51.0% | 42.0% |
| 2009 | 44.0% | 51.0% | 40.0% |
| 2008 | 27.0% | 45.0% | 37.0% |
| CST Summative High School Math Test | |||
| 2010 | 35.0% | 51.0% | 50.0% |
| 2009 | 49.0% | 47.0% | 47.0% |
| 2008 | 37.0% | 49.0% | 43.0% |
| CST U.S. History Test | |||
| 2010 | 38.0% | 53.0% | 45.0% |
| 2009 | 52.0% | 54.0% | 44.0% |
| 2008 | 30.0% | 43.0% | 38.0% |
| CST World History Test | |||
| 2010 | 10.0% | 9.0% | 15.0% |
| CST Algebra I Test | |||
| 2009 | 5.0% | 3.0% | 8.0% |
| 2008 | 4.0% | 6.0% | 5.0% |
| CST Earth Science Test | |||
| 2009 | 20.0% | 25.0% | 26.0% |
| 2008 | 7.0% | 25.0% | 28.0% |
| CST Geometry Test | |||
| 2009 | 3.0% | 7.0% | 7.0% |
End of Course - % of students at or above proficiency
| School | District | State | |
|---|---|---|---|
| CST Algebra I Test | |||
| 2010 | 14.0% | 28.0% | 31.0% |
| 2009 | 14.0% | 30.0% | 28.0% |
| 2008 | 9.0% | 29.0% | 25.0% |
| CST Algebra II Test | |||
| 2010 | 15.0% | 27.0% | 31.0% |
| 2009 | 17.0% | 22.0% | 28.0% |
| 2008 | 9.0% | 22.0% | 27.0% |
| CST Biology Test | |||
| 2010 | 38.0% | 52.0% | 46.0% |
| 2009 | 35.0% | 48.0% | 42.0% |
| 2008 | 36.0% | 48.0% | 42.0% |
| CST Chemistry Test | |||
| 2010 | 17.0% | 31.0% | 38.0% |
| 2009 | 30.0% | 34.0% | 36.0% |
| 2008 | 24.0% | 27.0% | 32.0% |
| CST Earth Science Test | |||
| 2010 | 19.0% | 23.0% | 33.0% |
| 2009 | 10.0% | 17.0% | 28.0% |
| 2008 | 14.0% | 19.0% | 28.0% |
| CST General Mathematics Test | |||
| 2010 | 8.0% | 12.0% | 27.0% |
| 2009 | 9.0% | 28.0% | 26.0% |
| 2008 | 8.0% | 31.0% | 27.0% |
| CST Geometry Test | |||
| 2010 | 11.0% | 32.0% | 27.0% |
| 2009 | 10.0% | 31.0% | 26.0% |
| 2008 | 13.0% | 28.0% | 24.0% |
| CST Summative High School Math Test | |||
| 2010 | 35.0% | 52.0% | 54.0% |
| 2009 | 47.0% | 47.0% | 50.0% |
| 2008 | 37.0% | 48.0% | 47.0% |
| CST World History Test | |||
| 2010 | 28.0% | 43.0% | 41.0% |
| 2009 | 32.0% | 42.0% | 38.0% |
| 2008 | 28.0% | 35.0% | 33.0% |
Source: CA Department of Education 2009-2010
School Map and Similar Schools Nearby
Click to Activate Map of Nearby School Campuses
Private
Public
This School
Similar Schools Nearby
| Northgate High School 9-12 | 1,476 Students | 2.0 miles away | Not Yet Rated | |
| Clayton Valley High School 9-12 | 1,868 Students | 3.1 miles away | Not Yet Rated | |
| College Park High School 9-12 | 2,034 Students | 3.2 miles away | Not Yet Rated | |
| Mt. Diablo High School 9-12 | 1,610 Students | 3.3 miles away | ![]() 5 out of 5 | |
| Concord High School 9-12 | 1,591 Students | 3.5 miles away | Not Yet Rated | |
| Las Lomas High School 9-12 | 1,454 Students | 3.7 miles away | Not Yet Rated | |
| Acalanes High School 9-12 | 1,371 Students | 4.6 miles away | Not Yet Rated | |
| Monte Vista High School 9-12 | 2,195 Students | 6.7 miles away | ![]() 4 out of 5 | |
| Campolindo High School 9-12 | 1,409 Students | 7.5 miles away | Not Yet Rated | |
| Alhambra High School 9-12 | 1,280 Students | 7.6 miles away | ![]() 5 out of 5 | |
Compare This School To Nearby Schools ->
School Community Forum

Join a discussion about Ygnacio Valley High School and talk to others in the community including students, parents, teachers, and administrators.
Popular Discussion Topics
- Admissions and Registration Questions (e.g. Dress Code and Discipline Policy)
- School Calendar and Upcoming Events (e.g. Graduation)
- After School Programs, Extracurricular Activities, and Athletics (e.g. Football)
- News and Announcements (e.g. Yearbook and Class Supply List Details)
- Graduate and Alumni Events (e.g. Organizing Class Reunions)
Navigation
Can't Find What You Are Looking For?
Rankings
Nearby Cities
Sponsored Links
K-12 Articles
Assisting Students to Overcome Test Anxiety
Every human copes with anxiety at one time or another. It is a basic emotion that we feel when...
School Lunches ... Hot or Cold?
First there were four, now there are six, no one knows how many more there may be in the future....
Helping Your Child Leave the Nest
It's all come down to this: Eighteen years of good times and bad, and now your baby bird is ready...


(5 / 5) 
