Presidio High School
Rating
Not Available
Not Available

1 out of 5 | 1 Review
Find Old Friends From Presidio High School
Use the form below to search for alumni from Presidio High School.
School Description
School Summary and Highlights
- Enrolls 317 elementary, middle, and high school students from grades KG-12
- Ranks 18th out of 385 high schools in AZ.
Additional Contact Information
- Mailing Address: 1695 East Fort Lowell Road, Tucson, AZ 85719
School Operational Details
- Title I EligibleAll students of this school are eligible for participation in authorized programs.
- Charter School
School District Details
- Presidio School District
- Per-Pupil Spending: $6,296
- Dropout Rate: 5.1%
- Enrolled Students: 317
Faculty Details and Student Enrollment
Students and Faculty
- Total Students Enrolled: 317
- Total Full Time "Equivalent" Teachers: 0
Students Gender Breakdown
- Males: 145 (45.7%)
- Females: 172 (54.3%)
Free Lunch Student Eligibility Breakdown
- Eligible for Reduced Lunch: 30 (9.5%)
- Eligible for Free Lunch: 194 (61.2%)
- Eligible for Either Reduced or Free Lunch: 224 (70.7%)
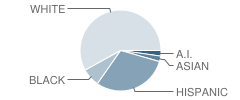
Student Enrollment Distribution by Race / Ethnicity
| Number | Percent | |
|---|---|---|
| American Indian | 7 | 2.2% |
| Black | 23 | 7.3% |
| Asian | 7 | 2.2% |
| Hispanic | 96 | 30.3% |
| White | 184 | 58.0% |
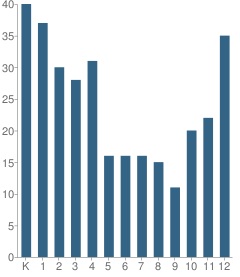
Number of Students Per Grade
| Number | Percent | |
|---|---|---|
| Kindergarten | 40 | 12.6% |
| 1st Grade | 37 | 11.7% |
| 2nd Grade | 30 | 9.5% |
| 3rd Grade | 28 | 8.8% |
| 4th Grade | 31 | 9.8% |
| 5th Grade | 16 | 5.0% |
| 6th Grade | 16 | 5.0% |
| 7th Grade | 16 | 5.0% |
| 8th Grade | 15 | 4.7% |
| 9th Grade | 11 | 3.5% |
| 10th Grade | 20 | 6.3% |
| 11th Grade | 22 | 6.9% |
| 12th Grade | 35 | 11.0% |
Source: AZ Department of Education, Source: NCES 2009-2010
School Ratings and Reviews
Overall Rating: 1

1 out of 5 | 1 Review
The Overall Rating is the school's average rating from parents, students, school faculty and staff. The highest rating is five apples and the lowest is one apple.
Share Your Review About This School
1 review for Presidio High School
- Reviewed by Former Student on January 17, 2011
- Rating:
 (1 / 5) Flag as inappropriate
 - this school is the absolute wost school i've EVER attended !
the staff was rude, and the carriculam was horrendous!
School Map and Similar Schools Nearby
Click to Activate Map of Nearby School Campuses
Private
Public
This School
Similar Schools Nearby
| Southern Arizona Community High School 9-12 | 212 Students | 1.1 miles away | Not Yet Rated | |
| Transformational Learning Centers School KG-12 | 87 Students | 1.7 miles away | Not Yet Rated | |
| Desert Rose Academy Charter School 9-12 | 352 Students | 1.8 miles away | Not Yet Rated | |
| Amerischools Academy - Country Club KG-12 | 225 Students | 2.2 miles away |  5 out of 5 | |
| Pima Partnership School, the 9-12 | 143 Students | 2.3 miles away | Not Yet Rated | |
| Tucson Preparatory School 9-12 | 168 Students | 2.4 miles away | Not Yet Rated | |
| Ombudsman - Charter Central School 6-12 | 61 Students | 2.5 miles away | Not Yet Rated | |
| Ha:san Preparatory & Leadership School 9-12 | 145 Students | 2.9 miles away | Not Yet Rated | |
| Basis Tucson School 5-12 | 651 Students | 3.0 miles away | Not Yet Rated | |
| Academy of Math and Science KG-12 | 300 Students | 3.2 miles away |  3 out of 5 | |
Compare This School To Nearby Schools ->
School Community Forum

Join a discussion about Presidio High School and talk to others in the community including students, parents, teachers, and administrators.
Popular Discussion Topics
- Admissions and Registration Questions (e.g. Dress Code and Discipline Policy)
- School Calendar and Upcoming Events (e.g. Graduation)
- After School Programs, Extracurricular Activities, and Athletics (e.g. Football)
- News and Announcements (e.g. Yearbook and Class Supply List Details)
- Graduate and Alumni Events (e.g. Organizing Class Reunions)
Navigation
Can't Find What You Are Looking For?
Sponsored Links
K-12 Articles

Teaching Your Kids About Respect, Values and Violence
These days it seems that every newscast reports at least once incident of violence. As parents, we...
These days it seems that every newscast reports at least once incident of violence. As parents, we...

Promoting Childhood Literacy
The number of American adults who are illiterate is astounding. People who lack the ability to read...
The number of American adults who are illiterate is astounding. People who lack the ability to read...

Breakfast, Kids and Learning
For generations parents have been telling their kids that breakfast is the most important meal of...
For generations parents have been telling their kids that breakfast is the most important meal of...