Kershaw Elementary School
Rating
Not Available
Not Available

5 out of 5 | 2 Reviews
Find Old Friends From Kershaw Elementary School
Use the form below to search for alumni from Kershaw Elementary School.
School Description
School Summary and Highlights
- Enrolls 223 preschool and elementary school students from grades PK-8
- Ranks 1014th out of 1,366 middle schools in IL.
Additional Contact Information
- Mailing Address: 6450 S Lowe Ave, Chicago, IL 60621
- Principal or Admin: Patricia Ann Johnson
School Operational Details
- Title I EligibleAll students of this school are eligible for participation in authorized programs.
School District Details
- Chicago Public Schools
- Per-Pupil Spending: $10,392
- Graduation Rate: 63.8%
- Dropout Rate: 16.3%
- Students Per Teacher: 17.8
- Enrolled Students: 406,068
Faculty Details and Student Enrollment
Students and Faculty
- Total Students Enrolled: 223
- Total Full Time "Equivalent" Teachers: 18.0
- Average Student-To-Teacher Ratio: 12.4
Students Gender Breakdown
- Males: 116 (52.0%)
- Females: 107 (48.0%)
Free Lunch Student Eligibility Breakdown
- Eligible for Reduced Lunch: 4 (1.8%)
- Eligible for Free Lunch: 216 (96.9%)
- Eligible for Either Reduced or Free Lunch: 220 (98.7%)
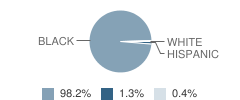
Student Enrollment Distribution by Race / Ethnicity
| Number | Percent | |
|---|---|---|
| American Indian | - | - |
| Black | 219 | 98.2% |
| Asian | - | - |
| Hispanic | 3 | 1.3% |
| White | 1 | 0.4% |
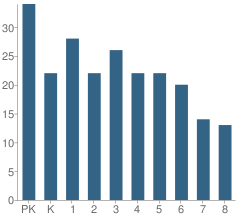
Number of Students Per Grade
| Number | Percent | |
|---|---|---|
| Pre-Kindergarten | 34 | 15.2% |
| Kindergarten | 22 | 9.9% |
| 1st Grade | 28 | 12.6% |
| 2nd Grade | 22 | 9.9% |
| 3rd Grade | 26 | 11.7% |
| 4th Grade | 22 | 9.9% |
| 5th Grade | 22 | 9.9% |
| 6th Grade | 20 | 9.0% |
| 7th Grade | 14 | 6.3% |
| 8th Grade | 13 | 5.8% |
Attendance, Graduation, and Dropout Rates (2010)
Attendance Rate
School:
93.7%
District:
91.5%
State:
93.9%
Source: IL Department of Education, Source: NCES 2009-2010
School Ratings and Reviews
Overall Rating: 5

5 out of 5 | 2 Reviews
The Overall Rating is the school's average rating from parents, students, school faculty and staff. The highest rating is five apples and the lowest is one apple.
Share Your Review About This School
2 reviews for Kershaw Elementary School
- Reviewed by Former Student on March 01, 2011
- Rating:
 (5 / 5) Flag as inappropriate
 - I went to this school in the early 70's...i really would like to know where I can purchase a yearbook from....
- Reviewed by Parent/Guardian on February 14, 2010
- Rating: (5 / 5) Flag as inappropriate
- i use to go to this school when i was little my daughter and all of her friends went here to
School Map and Similar Schools Nearby
Click to Activate Map of Nearby School Campuses
Private
Public
This School
Similar Schools Nearby
| Reed Elementary School 1-8 | 218 Students | 0.3 miles away | Not Yet Rated | |
| Banneker Elementary School PK-8 | 356 Students | 0.3 miles away | Not Yet Rated | |
| Mays Elementary Academy KG-8 | 343 Students | 0.4 miles away |  5 out of 5 | |
| Parker Elementary Community Academy PK-8 | 679 Students | 0.6 miles away | Not Yet Rated | |
| Nicholson Elementary Math & Science School PK-8 | 475 Students | 0.6 miles away | Not Yet Rated | |
| Bass Elementary School PK-8 | 411 Students | 0.7 miles away | Not Yet Rated | |
| Wentworth Elementary School PK-8 | 404 Students | 0.7 miles away | 5 out of 5 | |
| Woods Elementary Math & Science Academy PK-8 | 477 Students | 0.8 miles away |  4 out of 5 | |
| Hinton Elementary School PK-8 | 377 Students | 0.8 miles away | 4 out of 5 | |
| Yale Elementary School PK-8 | 247 Students | 0.9 miles away | 5 out of 5 | |
Compare This School To Nearby Schools ->
School Community Forum

Join a discussion about Kershaw Elementary School and talk to others in the community including students, parents, teachers, and administrators.
Popular Discussion Topics
- Admissions and Registration Questions (e.g. Dress Code and Discipline Policy)
- School Calendar and Upcoming Events (e.g. Graduation)
- After School Programs, Extracurricular Activities, and Athletics (e.g. Football)
- News and Announcements (e.g. Yearbook and Class Supply List Details)
- Graduate and Alumni Events (e.g. Organizing Class Reunions)
Navigation
Can't Find What You Are Looking For?
Rankings
Nearby Cities
Sponsored Links
K-12 Articles

Help Your Child Achieve Success in Middle School
Middle school is for children between the ages of 10 and 14 years. At this time children begin to...
Middle school is for children between the ages of 10 and 14 years. At this time children begin to...

Teach Your Child to Write Well
When American children head off to junior kindergarten, they must be ready to learn. It is your...
When American children head off to junior kindergarten, they must be ready to learn. It is your...

A Cheat Sheet on Cheating
Senior projects are coming due and finals are coming up. Spring has sprung, and with spring comes...
Senior projects are coming due and finals are coming up. Spring has sprung, and with spring comes...