Frontier High School

No Reviews Yet
Find Old Friends From Frontier High School
Use the form below to search for alumni from Frontier High School.
School Description
School Summary and Highlights
- Enrolls 2,444 high school students from grades 9-12
- Ranks 442nd out of 1,197 high schools in CA.
- 2010 Overall School AYP Met Status: Yes
Additional Contact Information
- Mailing Address: 6401 Allen Rd., Bakersfield, CA 93314
School District Details
- Kern Union High School District
- Per-Pupil Spending: $9,427
- Dropout Rate: 5.3%
- Students Per Teacher: 25.6
- Enrolled Students: 37,928
Faculty Details and Student Enrollment
Students and Faculty
- Total Students Enrolled: 2,444
- Total Full Time "Equivalent" Teachers: 85.1
- Average Student-To-Teacher Ratio: 28.7
Students Gender Breakdown
- Males: 1,228 (50.2%)
- Females: 1,216 (49.8%)
Free Lunch Student Eligibility Breakdown
- Eligible for Reduced Lunch: 172 (7.0%)
- Eligible for Free Lunch: 343 (14.0%)
- Eligible for Either Reduced or Free Lunch: 515 (21.1%)
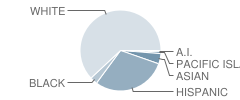
Student Enrollment Distribution by Race / Ethnicity

| Number | Percent | |
|---|---|---|
| American Indian | 18 | 0.7% |
| Black | 75 | 3.1% |
| Asian | 104 | 4.3% |
| Hispanic | 714 | 29.2% |
| White | 1,482 | 60.6% |
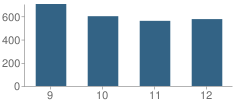
Number of Students Per Grade

| Number | Percent | |
|---|---|---|
| 9th Grade | 706 | 28.9% |
| 10th Grade | 601 | 24.6% |
| 11th Grade | 561 | 23.0% |
| 12th Grade | 576 | 23.6% |
Graduates Information (2010)
Graduation Rate
School:
92.4%
District:
78.6%
State:
78.6%
Teacher Education Background (2009)
Percent With Ph.D.
School:
1.0%
District:
8.8%
Percent With Master's Degree
School:
50.5%
District:
54.4%
Percent With Bachelor's Degree
School:
6.1%
District:
2.9%
Teacher Credentials & Experience (2009)
Percent of Teachers With Credentials: 98.9%
Number of Certificated Staff: 99.0
Average Number of Years of Teacher Experience: 10.3
Average Age
School:
37.2
District:
49.1
Source: CA Department of Education, Source: NCES 2009-2010
School Ratings and Reviews
Be The First To Review Frontier High School!
Sponsored Links
Test Scores and Performance Information
Overall School Rating
How is this determined?
The overall school rating shows that Frontier High School performed on average about the same as other schools across the state on CST state exams in the following subjects:
- CST Algebra I
- CST Algebra II
- CST Biology
- CST Chemistry
- CST Earth Science
- CST English-Language Arts
- CST General Mathematics
- CST Geometry
- CST Integrated Math 1
- CST Integrated/Coordinated Science
- CST Physics
- CST Science
- CST Summative High School Math
- CST U.S. History
- CST World History
AYP Results (2010)
Overall AYP Met: Yes
ELA AYP Met: Yes
Math AYP Met: Yes
ACT Exam Results (2009)
Percent of Students Taking ACT Exam: 4.6%
Average Combined Score: 23.9
Percent Scoring At or Above 21: 68.4%
SAT Exam Results (2009)
Percent of Students Taking SAT Exam: 26.7%
Average Combined Score: 1,473.0
Critical Reading Average: 487.1
Math Average: 506.0
Writing Average: 479.8
Percent Scoring At or Above 1500: 42.3%
CST - Test Proficiency by Grade and Subject
Grade 9 - % of students at or above proficiency
| School | District | State | |
|---|---|---|---|
| CST Algebra I Test | |||
| 2010 | 16.0% | 17.0% | 22.0% |
| 2009 | 24.0% | 18.0% | 21.0% |
| 2008 | 21.0% | 13.0% | 18.0% |
| CST Algebra II Test | |||
| 2010 | 63.0% | 48.0% | 69.0% |
| 2009 | 36.0% | 46.0% | 65.0% |
| CST Biology Test | |||
| 2010 | 85.0% | 58.0% | 55.0% |
| 2009 | 83.0% | 51.0% | 51.0% |
| 2008 | 75.0% | 53.0% | 52.0% |
| CST Earth Science Test | |||
| 2010 | 42.0% | 36.0% | 35.0% |
| 2009 | 41.0% | 35.0% | 29.0% |
| 2008 | 41.0% | 30.0% | 31.0% |
| CST English-Language Arts Test | |||
| 2010 | 61.0% | 44.0% | 54.0% |
| 2009 | 58.0% | 41.0% | 50.0% |
| 2008 | 52.0% | 37.0% | 49.0% |
| CST General Mathematics Test | |||
| 2010 | 3.0% | 8.0% | 17.0% |
| 2009 | - | - | - |
| 2008 | 2.0% | 8.0% | 18.0% |
| CST Geometry Test | |||
| 2010 | 60.0% | 44.0% | 46.0% |
| 2009 | 72.0% | 46.0% | 47.0% |
| 2008 | 56.0% | 40.0% | 43.0% |
| CST Integrated/Coordinated Science Test | |||
| 2010 | 39.0% | 19.0% | 19.0% |
| 2009 | 29.0% | 14.0% | 15.0% |
| 2008 | 18.0% | 10.0% | 5.0% |
| CST World History Test | |||
| 2010 | 14.0% | 7.0% | 45.0% |
| 2009 | 12.0% | 7.0% | 41.0% |
| 2008 | 19.0% | 6.0% | 36.0% |
Grade 10 - % of students at or above proficiency
| School | District | State | |
|---|---|---|---|
| CST Algebra I Test | |||
| 2010 | 3.0% | 6.0% | 12.0% |
| 2009 | 9.0% | 5.0% | 11.0% |
| 2008 | 4.0% | 4.0% | 9.0% |
| CST Algebra II Test | |||
| 2010 | 46.0% | 42.0% | 40.0% |
| 2009 | 43.0% | 41.0% | 37.0% |
| 2008 | 39.0% | 34.0% | 36.0% |
| CST Biology Test | |||
| 2010 | 51.0% | 40.0% | 38.0% |
| 2009 | 43.0% | 33.0% | 34.0% |
| 2008 | 44.0% | 28.0% | 35.0% |
| CST Chemistry Test | |||
| 2010 | 74.0% | 63.0% | 47.0% |
| 2009 | 73.0% | 62.0% | 44.0% |
| 2008 | 61.0% | 55.0% | 41.0% |
| CST English-Language Arts Test | |||
| 2010 | 49.0% | 41.0% | 45.0% |
| 2009 | 53.0% | 38.0% | 44.0% |
| 2008 | 42.0% | 33.0% | 41.0% |
| CST Geometry Test | |||
| 2010 | 9.0% | 12.0% | 14.0% |
| 2009 | 14.0% | 11.0% | 14.0% |
| 2008 | 9.0% | 8.0% | 12.0% |
| CST Science Test | |||
| 2010 | 62.0% | 47.0% | 46.0% |
| 2009 | 63.0% | 43.0% | 44.0% |
| 2008 | 48.0% | 34.0% | 40.0% |
| CST World History Test | |||
| 2010 | 57.0% | 40.0% | 42.0% |
| 2009 | 53.0% | 33.0% | 38.0% |
| 2008 | 37.0% | 26.0% | 33.0% |
| CST Earth Science Test | |||
| 2009 | 53.0% | 22.0% | 23.0% |
| 2008 | 63.0% | 24.0% | 23.0% |
Grade 11 - % of students at or above proficiency
| School | District | State | |
|---|---|---|---|
| CST Algebra I Test | |||
| 2010 | 6.0% | 5.0% | 8.0% |
| 2009 | 6.0% | 4.0% | 8.0% |
| 2008 | 3.0% | 2.0% | 5.0% |
| CST Algebra II Test | |||
| 2010 | 16.0% | 13.0% | 14.0% |
| 2009 | 5.0% | 10.0% | 12.0% |
| 2008 | 4.0% | 8.0% | 11.0% |
| CST Chemistry Test | |||
| 2010 | 33.0% | 25.0% | 30.0% |
| 2009 | 24.0% | 22.0% | 27.0% |
| 2008 | 24.0% | 18.0% | 25.0% |
| CST Earth Science Test | |||
| 2010 | 43.0% | 19.0% | 32.0% |
| 2009 | 37.0% | 14.0% | 26.0% |
| 2008 | 29.0% | 10.0% | 28.0% |
| CST English-Language Arts Test | |||
| 2010 | 46.0% | 34.0% | 42.0% |
| 2009 | 45.0% | 30.0% | 40.0% |
| 2008 | 35.0% | 25.0% | 37.0% |
| CST Geometry Test | |||
| 2010 | 6.0% | 5.0% | 6.0% |
| 2009 | 3.0% | 3.0% | 7.0% |
| 2008 | 1.0% | 3.0% | 6.0% |
| CST Integrated Math 1 Test | |||
| 2010 | 7.0% | 5.0% | 11.0% |
| 2009 | 7.0% | 7.0% | 9.0% |
| 2008 | 7.0% | 5.0% | 9.0% |
| CST Physics Test | |||
| 2010 | 80.0% | 48.0% | 53.0% |
| 2009 | 57.0% | 39.0% | 50.0% |
| 2008 | 26.0% | 28.0% | 47.0% |
| CST Summative High School Math Test | |||
| 2010 | 48.0% | 43.0% | 50.0% |
| 2009 | 40.0% | 39.0% | 47.0% |
| 2008 | 41.0% | 32.0% | 43.0% |
| CST U.S. History Test | |||
| 2010 | 60.0% | 41.0% | 45.0% |
| 2009 | 56.0% | 35.0% | 44.0% |
| 2008 | 43.0% | 28.0% | 38.0% |
End of Course - % of students at or above proficiency
| School | District | State | |
|---|---|---|---|
| CST Algebra I Test | |||
| 2010 | 12.0% | 12.0% | 31.0% |
| 2009 | 19.0% | 12.0% | 28.0% |
| 2008 | 15.0% | 9.0% | 25.0% |
| CST Algebra II Test | |||
| 2010 | 31.0% | 27.0% | 31.0% |
| 2009 | 21.0% | 25.0% | 28.0% |
| 2008 | 20.0% | 21.0% | 27.0% |
| CST Biology Test | |||
| 2010 | 58.0% | 43.0% | 46.0% |
| 2009 | 52.0% | 35.0% | 42.0% |
| 2008 | 51.0% | 31.0% | 42.0% |
| CST Chemistry Test | |||
| 2010 | 45.0% | 31.0% | 38.0% |
| 2009 | 37.0% | 29.0% | 36.0% |
| 2008 | 35.0% | 23.0% | 32.0% |
| CST Earth Science Test | |||
| 2010 | 43.0% | 32.0% | 33.0% |
| 2009 | 40.0% | 29.0% | 28.0% |
| 2008 | 36.0% | 24.0% | 28.0% |
| CST General Mathematics Test | |||
| 2010 | 3.0% | 8.0% | 27.0% |
| 2009 | - | - | - |
| 2008 | 2.0% | 8.0% | 27.0% |
| CST Geometry Test | |||
| 2010 | 26.0% | 20.0% | 27.0% |
| 2009 | 28.0% | 19.0% | 26.0% |
| 2008 | 20.0% | 16.0% | 24.0% |
| CST Integrated Math 1 Test | |||
| 2010 | 7.0% | 4.0% | 13.0% |
| 2009 | 6.0% | 7.0% | 11.0% |
| 2008 | 6.0% | 4.0% | 11.0% |
| CST Integrated/Coordinated Science Test | |||
| 2010 | 39.0% | 16.0% | 16.0% |
| 2009 | 29.0% | 9.0% | 13.0% |
| 2008 | 18.0% | 10.0% | 11.0% |
| CST Physics Test | |||
| 2010 | 80.0% | 51.0% | 49.0% |
| 2009 | 57.0% | 41.0% | 46.0% |
| 2008 | 28.0% | 30.0% | 43.0% |
| CST Summative High School Math Test | |||
| 2010 | 48.0% | 43.0% | 54.0% |
| 2009 | 40.0% | 39.0% | 50.0% |
| 2008 | 41.0% | 33.0% | 47.0% |
| CST World History Test | |||
| 2010 | 56.0% | 37.0% | 41.0% |
| 2009 | 51.0% | 30.0% | 38.0% |
| 2008 | 36.0% | 24.0% | 33.0% |
Source: CA Department of Education 2009-2010
School Map and Similar Schools Nearby
Click to Activate Map of Nearby School Campuses
Private
Public
This School
Similar Schools Nearby
| Centennial High School 9-12 | 1,858 Students | 2.9 miles away | Not Yet Rated | |
| Fruitvale Junior High School 7-8 | 702 Students | 3.4 miles away | Not Yet Rated | |
| Liberty High School 9-12 | 1,856 Students | 3.9 miles away | Not Yet Rated | |
| Beardsley Junior High School 7-8 | 361 Students | 5.9 miles away | Not Yet Rated | |
| Stockdale High School 9-12 | 2,192 Students | 6.2 miles away | Not Yet Rated | |
| North High School 9-12 | 2,195 Students | 6.8 miles away | ![]() 2.5 out of 5 | |
| West High School 9-12 | 2,119 Students | 7.0 miles away | ![]() 5 out of 5 | |
| Tevis Junior High School 7-8 | 729 Students | 7.3 miles away | ![]() 5 out of 5 | |
| Earl Warren Junior High School 7-8 | 817 Students | 7.4 miles away | ![]() 4 out of 5 | |
| O. J. Actis Junior High School 7-8 | 714 Students | 7.4 miles away | ![]() 5 out of 5 | |
Compare This School To Nearby Schools ->
School Community Forum

Join a discussion about Frontier High School and talk to others in the community including students, parents, teachers, and administrators.
Popular Discussion Topics
- Admissions and Registration Questions (e.g. Dress Code and Discipline Policy)
- School Calendar and Upcoming Events (e.g. Graduation)
- After School Programs, Extracurricular Activities, and Athletics (e.g. Football)
- News and Announcements (e.g. Yearbook and Class Supply List Details)
- Graduate and Alumni Events (e.g. Organizing Class Reunions)
Navigation
Can't Find What You Are Looking For?
Rankings
Nearby Cities
Sponsored Links
K-12 Articles
Homework Helps
School has started throughout the country and is well into the first month-some schools are...
The Difference Between Boys and Girls
Boys and girls are different. Give a toddler girl a G.I. Joe and she'll probably try to mother it....
Your Child and School Corporal Punishment
Your child comes home at the end of the school day with a huge bruise on his upper arm. When you...


