Miguel Contreras Learning Complex School
Rating
Not Available
Not Available

5 out of 5 | 2 Reviews
Find Old Friends From Miguel Contreras Learning Complex School
Use the form below to search for alumni from Miguel Contreras Learning Complex School.
School Description
School Summary and Highlights
- Enrolls 939 high school students from grades 9-12
- Ranks 1132nd out of 1,197 high schools in CA.
- 2010 Overall School AYP Met Status: No
Additional Contact Information
- Mailing Address: 322 Lucas Ave., Los Angeles, CA 90017
School Operational Details
- Title I EligibleAll students of this school are eligible for participation in authorized programs.
School District Details
- Los Angeles Unified School District
- Per-Pupil Spending: $11,357
- Graduation Rate: 48.8%
- Dropout Rate: 6.8%
- Students Per Teacher: 21.3
- Enrolled Students: 667,870
Faculty Details and Student Enrollment
Students and Faculty
- Total Students Enrolled: 939
- Total Full Time "Equivalent" Teachers: 38.8
- Average Student-To-Teacher Ratio: 24.2
Students Gender Breakdown
- Males: 451 (48.0%)
- Females: 488 (52.0%)
Free Lunch Student Eligibility Breakdown
- Eligible for Reduced Lunch: 31 (3.3%)
- Eligible for Free Lunch: 777 (82.7%)
- Eligible for Either Reduced or Free Lunch: 808 (86.0%)
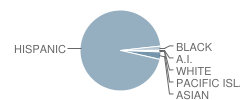
Student Enrollment Distribution by Race / Ethnicity
| Number | Percent | |
|---|---|---|
| American Indian | 3 | 0.3% |
| Black | 16 | 1.7% |
| Asian | 28 | 3.0% |
| Hispanic | 885 | 94.2% |
| White | 1 | 0.1% |
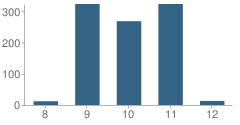
Number of Students Per Grade
| Number | Percent | |
|---|---|---|
| 8th Grade | 12 | 1.3% |
| 9th Grade | 323 | 34.4% |
| 10th Grade | 268 | 28.5% |
| 11th Grade | 323 | 34.4% |
| 12th Grade | 13 | 1.4% |
Graduates Information (2010)
Graduation Rate
School:
56.3%
District:
69.1%
State:
78.6%
Teacher Education Background (2009)
Percent With Ph.D.
School:
3.9%
District:
3.7%
Percent With Master's Degree
School:
19.6%
District:
26.9%
Percent With Bachelor's Degree
School:
31.4%
District:
31.9%
Teacher Credentials & Experience (2009)
Percent of Teachers With Credentials: 88.6%
Number of Certificated Staff: 51.0
Average Number of Years of Teacher Experience: 8.6
Average Age
School:
38.9
District:
46.7
Source: CA Department of Education, Source: NCES 2009-2010
School Ratings and Reviews
Overall Rating: 5

5 out of 5 | 2 Reviews
The Overall Rating is the school's average rating from parents, students, school faculty and staff. The highest rating is five apples and the lowest is one apple.
Share Your Review About This School
2 reviews for Miguel Contreras Learning Complex School
- Reviewed by Student on February 12, 2010
- Rating:
 (5 / 5) Flag as inappropriate
 - Miguel Contreras Learning Complex is a amazing school!!!
I am a ninth grader attending the the SLC Social Justice. It is the best!
This school gives a good vibe to anyone attending there.
All the teachers are just fun and really cool to be with!
i love it!
- Reviewed by Student on October 04, 2009
- Rating: (5 / 5) Flag as inappropriate
- i love this school is so GREAT!
School Map and Similar Schools Nearby
Click to Activate Map of Nearby School Campuses
Private
Public
This School
Similar Schools Nearby
| Academic Leadership Community School 9-12 | 445 Students | 0 miles away | Not Yet Rated | - |
| Los Angeles Teachers Preparatory Academy 9-12 | 229 Students | 0.3 miles away | Not Yet Rated | - |
| School for the Visual Arts and Humanities 9-12 | 398 Students | 0.5 miles away | Not Yet Rated | - |
| Central La Area New High School #9 9-12 | 1,089 Students | 1.0 miles away | Not Yet Rated | - |
| Santee Education Complex School 9-12 | 2,857 Students | 2.0 miles away |  5 out of 5 | |
| West Adams Preparatory High School 9-12 | 2,618 Students | 2.0 miles away | Not Yet Rated | - |
| School of Math and Science 9-12 | 409 Students | 2.1 miles away | Not Yet Rated | - |
| School of Engineering and Technology 9-12 | 403 Students | 2.1 miles away | Not Yet Rated | - |
| Theodore Roosevelt High School 9-12 | 3,819 Students | 3.2 miles away | Not Yet Rated | |
| Student Empowerment Academy 9-12 | 375 Students | 3.4 miles away | Not Yet Rated | - |
Compare This School To Nearby Schools ->
School Community Forum

Join a discussion about Miguel Contreras Learning Complex School and talk to others in the community including students, parents, teachers, and administrators.
Popular Discussion Topics
- Admissions and Registration Questions (e.g. Dress Code and Discipline Policy)
- School Calendar and Upcoming Events (e.g. Graduation)
- After School Programs, Extracurricular Activities, and Athletics (e.g. Football)
- News and Announcements (e.g. Yearbook and Class Supply List Details)
- Graduate and Alumni Events (e.g. Organizing Class Reunions)
Navigation
Can't Find What You Are Looking For?
Rankings
Sponsored Links
K-12 Articles

Teaching Your Kids About Respect, Values and Violence
These days it seems that every newscast reports at least once incident of violence. As parents, we...
These days it seems that every newscast reports at least once incident of violence. As parents, we...

Internet Safety for Kids of All Ages
Kids are being introduced to the Internet at a very young age. Research for homework and school...
Kids are being introduced to the Internet at a very young age. Research for homework and school...

Hurt: A Book Report
My last book report was over 15 years ago, and I'm a bit rusty, but here goes (Don't forget: book...
My last book report was over 15 years ago, and I'm a bit rusty, but here goes (Don't forget: book...