Granite Hills High School

5 out of 5 | 1 Review
Find Old Friends From Granite Hills High School
Use the form below to search for alumni from Granite Hills High School.
School Description
School Summary and Highlights
- Enrolls 2,013 high school students from grades 9-12
- Ranks 786th out of 1,197 high schools in CA.
- 2010 Overall School AYP Met Status: No
Additional Contact Information
- Mailing Address: 22900 Esaws Rd., Apple Valley, CA 92307
School Operational Details
- Title I Eligible
School District Details
- Apple Valley Unified School District
- Per-Pupil Spending: $7,280
- Graduation Rate: 80.6%
- Dropout Rate: 4.6%
- Students Per Teacher: 24.2
- Enrolled Students: 15,012
Faculty Details and Student Enrollment
Students and Faculty
- Total Students Enrolled: 2,013
- Total Full Time "Equivalent" Teachers: 72.0
- Average Student-To-Teacher Ratio: 28.0
Students Gender Breakdown
- Males: 1,062 (52.8%)
- Females: 951 (47.2%)
Free Lunch Student Eligibility Breakdown
- Eligible for Reduced Lunch: 232 (11.5%)
- Eligible for Free Lunch: 786 (39.0%)
- Eligible for Either Reduced or Free Lunch: 1,018 (50.6%)
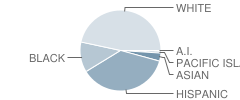
Student Enrollment Distribution by Race / Ethnicity

| Number | Percent | |
|---|---|---|
| American Indian | 10 | 0.5% |
| Black | 242 | 12.0% |
| Asian | 67 | 3.3% |
| Hispanic | 735 | 36.5% |
| White | 925 | 46.0% |
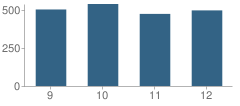
Number of Students Per Grade

| Number | Percent | |
|---|---|---|
| 9th Grade | 503 | 25.0% |
| 10th Grade | 539 | 26.8% |
| 11th Grade | 474 | 23.5% |
| 12th Grade | 497 | 24.7% |
Graduates Information (2010)
Graduation Rate
School:
87.7%
District:
76.0%
State:
78.6%
Teacher Education Background (2009)
Percent With Ph.D.: 1.1%
Percent With Master's Degree
School:
33.3%
District:
50.0%
Percent With Bachelor's Degree
School:
1.1%
District:
4.5%
Teacher Credentials & Experience (2009)
Percent of Teachers With Emergency Credentials: 2.6%
Percent of Teachers With Credentials: 92.3%
Number of Certificated Staff: 90.0
Average Number of Years of Teacher Experience: 12.7
Average Age
School:
43.9
District:
47.7
Source: CA Department of Education, Source: NCES 2009-2010
Sponsored Links
Test Scores and Performance Information
Overall School Rating
How is this determined?
The overall school rating shows that Granite Hills High School performed on average about the same as other schools across the state on CST state exams in the following subjects:
- CST Algebra I
- CST Algebra II
- CST Biology
- CST Chemistry
- CST Earth Science
- CST English-Language Arts
- CST General Mathematics
- CST Geometry
- CST Physics
- CST Science
- CST Summative High School Math
- CST U.S. History
- CST World History
AYP Results (2010)
Overall AYP Met: No
ELA AYP Met: No
Math AYP Met: No
Program Improvement (PI) Requirement Under NCLB (2010)
First Year PI Requirement was Implemented: 2009-2010
School's Placement Under NCLB: Year 2
ACT Exam Results (2009)
Percent of Students Taking ACT Exam: 17.3%
Average Combined Score: 22.8
Percent Scoring At or Above 21: 63.9%
SAT Exam Results (2009)
Percent of Students Taking SAT Exam: 35.1%
Average Combined Score: 1,512.1
Critical Reading Average: 505.4
Math Average: 503.5
Writing Average: 503.2
Percent Scoring At or Above 1500: 47.0%
CST - Test Proficiency by Grade and Subject
Grade 9 - % of students at or above proficiency
| School | District | State | |
|---|---|---|---|
| CST Algebra I Test | |||
| 2010 | 5.0% | 9.0% | 22.0% |
| 2009 | 9.0% | 10.0% | 21.0% |
| 2008 | 7.0% | 7.0% | 18.0% |
| CST Algebra II Test | |||
| 2010 | 45.0% | 52.0% | 69.0% |
| 2009 | 37.0% | 37.0% | 65.0% |
| 2008 | 22.0% | 25.0% | 66.0% |
| CST Biology Test | |||
| 2010 | 51.0% | 57.0% | 55.0% |
| 2009 | 49.0% | 45.0% | 51.0% |
| 2008 | 52.0% | 49.0% | 52.0% |
| CST Earth Science Test | |||
| 2010 | 9.0% | 21.0% | 35.0% |
| 2009 | 13.0% | 18.0% | 29.0% |
| 2008 | 14.0% | 18.0% | 31.0% |
| CST English-Language Arts Test | |||
| 2010 | 44.0% | 50.0% | 54.0% |
| 2009 | 48.0% | 45.0% | 50.0% |
| 2008 | 45.0% | 45.0% | 49.0% |
| CST General Mathematics Test | |||
| 2010 | 7.0% | 8.0% | 17.0% |
| 2009 | 3.0% | 4.0% | 17.0% |
| 2008 | 5.0% | 4.0% | 18.0% |
| CST Geometry Test | |||
| 2010 | 20.0% | 21.0% | 46.0% |
| 2009 | 31.0% | 27.0% | 47.0% |
| CST World History Test | |||
| 2009 | 36.0% | 18.0% | 41.0% |
| 2008 | 47.0% | 24.0% | 36.0% |
Grade 10 - % of students at or above proficiency
| School | District | State | |
|---|---|---|---|
| CST Algebra I Test | |||
| 2010 | 6.0% | 7.0% | 12.0% |
| 2009 | 15.0% | 7.0% | 11.0% |
| 2008 | 9.0% | 5.0% | 9.0% |
| CST Algebra II Test | |||
| 2010 | 18.0% | 18.0% | 40.0% |
| 2009 | 5.0% | 7.0% | 37.0% |
| 2008 | 4.0% | 5.0% | 36.0% |
| CST Biology Test | |||
| 2010 | 22.0% | 29.0% | 38.0% |
| 2009 | 25.0% | 20.0% | 34.0% |
| 2008 | 34.0% | 32.0% | 35.0% |
| CST Chemistry Test | |||
| 2010 | 47.0% | 39.0% | 47.0% |
| 2009 | 56.0% | 37.0% | 44.0% |
| 2008 | 45.0% | 36.0% | 41.0% |
| CST Earth Science Test | |||
| 2010 | 34.0% | 30.0% | 29.0% |
| 2009 | 25.0% | 21.0% | 23.0% |
| 2008 | 26.0% | 21.0% | 23.0% |
| CST English-Language Arts Test | |||
| 2010 | 39.0% | 41.0% | 45.0% |
| 2009 | 41.0% | 37.0% | 44.0% |
| 2008 | 37.0% | 33.0% | 41.0% |
| CST Geometry Test | |||
| 2010 | 11.0% | 10.0% | 14.0% |
| 2009 | 12.0% | 7.0% | 14.0% |
| 2008 | 21.0% | 7.0% | 12.0% |
| CST Science Test | |||
| 2010 | 40.0% | 42.0% | 46.0% |
| 2009 | 39.0% | 36.0% | 44.0% |
| 2008 | 40.0% | 35.0% | 40.0% |
| CST Summative High School Math Test | |||
| 2010 | 36.0% | 52.0% | 75.0% |
| 2009 | 59.0% | 49.0% | 71.0% |
| 2008 | 31.0% | 33.0% | 68.0% |
| CST World History Test | |||
| 2010 | 39.0% | 40.0% | 42.0% |
| 2009 | 31.0% | 24.0% | 38.0% |
| 2008 | 29.0% | 27.0% | 33.0% |
Grade 11 - % of students at or above proficiency
| School | District | State | |
|---|---|---|---|
| CST Algebra I Test | |||
| 2010 | 11.0% | 6.0% | 8.0% |
| 2009 | 14.0% | 8.0% | 8.0% |
| 2008 | 8.0% | 4.0% | 5.0% |
| CST Algebra II Test | |||
| 2010 | 4.0% | 7.0% | 14.0% |
| 2009 | 6.0% | 3.0% | 12.0% |
| 2008 | 8.0% | 7.0% | 11.0% |
| CST Biology Test | |||
| 2010 | 31.0% | 44.0% | 46.0% |
| 2009 | 40.0% | 38.0% | 41.0% |
| 2008 | 37.0% | 35.0% | 39.0% |
| CST Chemistry Test | |||
| 2010 | 37.0% | 33.0% | 30.0% |
| 2009 | 32.0% | 17.0% | 27.0% |
| 2008 | 42.0% | 27.0% | 25.0% |
| CST Earth Science Test | |||
| 2010 | 42.0% | 41.0% | 32.0% |
| 2009 | 31.0% | 26.0% | 26.0% |
| 2008 | 37.0% | 30.0% | 28.0% |
| CST English-Language Arts Test | |||
| 2010 | 43.0% | 40.0% | 42.0% |
| 2009 | 43.0% | 34.0% | 40.0% |
| 2008 | 34.0% | 31.0% | 37.0% |
| CST Geometry Test | |||
| 2010 | 12.0% | 8.0% | 6.0% |
| 2009 | 11.0% | 7.0% | 7.0% |
| 2008 | 6.0% | 3.0% | 6.0% |
| CST Physics Test | |||
| 2010 | 71.0% | 71.0% | 53.0% |
| 2009 | 85.0% | 77.0% | 50.0% |
| 2008 | 61.0% | 60.0% | 47.0% |
| CST Summative High School Math Test | |||
| 2010 | 40.0% | 34.0% | 50.0% |
| 2009 | 38.0% | 28.0% | 47.0% |
| 2008 | 32.0% | 27.0% | 43.0% |
| CST U.S. History Test | |||
| 2010 | 57.0% | 47.0% | 45.0% |
| 2009 | 53.0% | 42.0% | 44.0% |
| 2008 | 33.0% | 33.0% | 38.0% |
| CST World History Test | |||
| 2010 | 20.0% | 4.0% | 15.0% |
End of Course - % of students at or above proficiency
| School | District | State | |
|---|---|---|---|
| CST Algebra I Test | |||
| 2010 | 6.0% | 24.0% | 31.0% |
| 2009 | 12.0% | 19.0% | 28.0% |
| 2008 | 7.0% | 15.0% | 25.0% |
| CST Algebra II Test | |||
| 2010 | 19.0% | 20.0% | 31.0% |
| 2009 | 18.0% | 13.0% | 28.0% |
| 2008 | 11.0% | 12.0% | 27.0% |
| CST Biology Test | |||
| 2010 | 38.0% | 45.0% | 46.0% |
| 2009 | 41.0% | 37.0% | 42.0% |
| 2008 | 42.0% | 40.0% | 42.0% |
| CST Chemistry Test | |||
| 2010 | 43.0% | 37.0% | 38.0% |
| 2009 | 47.0% | 28.0% | 36.0% |
| 2008 | 44.0% | 32.0% | 32.0% |
| CST Earth Science Test | |||
| 2010 | 25.0% | 28.0% | 33.0% |
| 2009 | 21.0% | 20.0% | 28.0% |
| 2008 | 21.0% | 22.0% | 28.0% |
| CST General Mathematics Test | |||
| 2010 | 7.0% | 22.0% | 27.0% |
| 2009 | 3.0% | 16.0% | 26.0% |
| 2008 | 5.0% | 28.0% | 27.0% |
| CST Geometry Test | |||
| 2010 | 13.0% | 17.0% | 27.0% |
| 2009 | 14.0% | 18.0% | 26.0% |
| 2008 | 13.0% | 14.0% | 24.0% |
| CST Physics Test | |||
| 2010 | 70.0% | 70.0% | 49.0% |
| 2009 | 84.0% | 76.0% | 46.0% |
| 2008 | 61.0% | 60.0% | 43.0% |
| CST Summative High School Math Test | |||
| 2010 | 39.0% | 39.0% | 54.0% |
| 2009 | 43.0% | 34.0% | 50.0% |
| 2008 | 32.0% | 29.0% | 47.0% |
| CST World History Test | |||
| 2010 | 38.0% | 37.0% | 41.0% |
| 2009 | 31.0% | 23.0% | 38.0% |
| 2008 | 29.0% | 26.0% | 33.0% |
Source: CA Department of Education 2009-2010
School Map and Similar Schools Nearby
Click to Activate Map of Nearby School Campuses
Private
Public
This School
Similar Schools Nearby
| Apple Valley High School 9-12 | 2,145 Students | 3.2 miles away | ![]() 5 out of 5 | |
| Sultana High School 9-12 | 2,386 Students | 9.7 miles away | ![]() 3.5 out of 5 | |
| Imogene Garner Hook Junior High School 7-8 | 904 Students | 9.9 miles away | ![]() 5 out of 5 | |
| Hesperia Junior High School 7-8 | 1,137 Students | 10.4 miles away | Not Yet Rated | |
| Hesperia High School 9-12 | 2,293 Students | 11.7 miles away | ![]() 5 out of 5 | |
| Silverado High School 9-12 | 3,753 Students | 11.9 miles away | ![]() 3.5 out of 5 | |
| Lucerne Valley High School 9-12 | 311 Students | 13.3 miles away | ![]() 1 out of 5 | |
| Rim of the World High School 9-12 | 1,402 Students | 19.3 miles away | ![]() 3.5 out of 5 | |
| Cajon High School 9-12 | 2,913 Students | 24.5 miles away | ![]() 4.5 out of 5 | |
Compare This School To Nearby Schools ->
School Community Forum

Join a discussion about Granite Hills High School and talk to others in the community including students, parents, teachers, and administrators.
Popular Discussion Topics
- Admissions and Registration Questions (e.g. Dress Code and Discipline Policy)
- School Calendar and Upcoming Events (e.g. Graduation)
- After School Programs, Extracurricular Activities, and Athletics (e.g. Football)
- News and Announcements (e.g. Yearbook and Class Supply List Details)
- Graduate and Alumni Events (e.g. Organizing Class Reunions)
Navigation
Can't Find What You Are Looking For?
Rankings
Nearby Cities
Sponsored Links
K-12 Articles
Just a Harmless Vanilla Bean?
Some of the greatest, most used, and most profitable breakthroughs in science have not been made by...
The Adolescent Monster
"What happened to my sweet little baby?" Every parent has or will ask that sometime during the...
The Importance of Ninth Grade
Students who are entering ninth grade do not realize the importance of the critical decisions they...


(5 / 5) 


