Glenside Elementary School
Rating
Not Available
Not Available

No Reviews Yet
Find Old Friends From Glenside Elementary School
Use the form below to search for alumni from Glenside Elementary School.
School Description
School Summary and Highlights
- Enrolls 377 preschool and elementary school students from grades PK-5
- Ranks 1662nd out of 1,895 elementary schools in PA.
- 2010 Overall School AYP Met Status: Made AYP
Additional Contact Information
- Principal or Admin: Melissa Fisher
School Operational Details
- Title I EligibleAll students of this school are eligible for participation in authorized programs.
School District Details
- Reading School District
- Per-Pupil Spending: $8,973
- Graduation Rate: 53.4%
- Dropout Rate: 8.1%
- Students Per Teacher: 15.8
- Enrolled Students: 17,869
Faculty Details and Student Enrollment
Students and Faculty
- Total Students Enrolled: 377
- Total Full Time "Equivalent" Teachers: 29.3
- Average Student-To-Teacher Ratio: 12.9
Students Gender Breakdown
- Males: 200 (53.1%)
- Females: 177 (46.9%)
Free Lunch Student Eligibility Breakdown
- Eligible for Reduced Lunch: 10 (2.7%)
- Eligible for Free Lunch: 348 (92.3%)
- Eligible for Either Reduced or Free Lunch: 358 (95.0%)
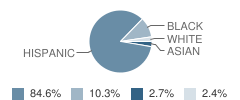
Student Enrollment Distribution by Race / Ethnicity
| Number | Percent | |
|---|---|---|
| American Indian | - | - |
| Black | 39 | 10.3% |
| Asian | 10 | 2.7% |
| Hispanic | 319 | 84.6% |
| White | 9 | 2.4% |
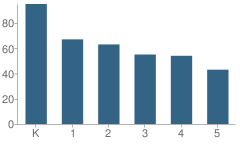
Number of Students Per Grade
| Number | Percent | |
|---|---|---|
| Kindergarten | 95 | 25.2% |
| 1st Grade | 67 | 17.8% |
| 2nd Grade | 63 | 16.7% |
| 3rd Grade | 55 | 14.6% |
| 4th Grade | 54 | 14.3% |
| 5th Grade | 43 | 11.4% |
Low-Income Enrollment (2011)
Percent of Students from Low-Income Families
School:
95.2%
District:
90.6%
Source: PA Department of Education, Source: NCES 2009-2010
School Ratings and Reviews
Be The First To Review Glenside Elementary School!
School Map and Similar Schools Nearby
Click to Activate Map of Nearby School Campuses
Private
Public
This School
Similar Schools Nearby
| Northwest Elementary School PK-5 | 767 Students | 0.7 miles away | Not Yet Rated | |
| Riverside Elementary School PK-5 | 914 Students | 0.9 miles away |  4 out of 5 | |
| Lauers Park Elementary School PK-5 | 785 Students | 1.5 miles away |  5 out of 5 | |
| Twelfth & Marion Elementary School 1-5 | 531 Students | 1.9 miles away | Not Yet Rated | |
| Tenth & Green Elementary School PK-5 | 691 Students | 2.0 miles away | Not Yet Rated | |
| Thirteenth & Union Elementary School PK-5 | 1,035 Students | 2.0 miles away | Not Yet Rated | |
| Spring Ridge Elementary School KG-6 | 449 Students | 2.1 miles away | Not Yet Rated | |
| Tyson-Schoener Elementary School PK-5 | 648 Students | 2.2 miles away | 5 out of 5 | |
| Wyomissing Hills Elementary Center School KG-4 | 670 Students | 2.2 miles away | 5 out of 5 | |
| Tenth & Penn Elementary School PK-5 | 555 Students | 2.2 miles away | 5 out of 5 | |
Compare This School To Nearby Schools ->
School Community Forum

Join a discussion about Glenside Elementary School and talk to others in the community including students, parents, teachers, and administrators.
Popular Discussion Topics
- Admissions and Registration Questions (e.g. Dress Code and Discipline Policy)
- School Calendar and Upcoming Events (e.g. Graduation)
- After School Programs, Extracurricular Activities, and Athletics (e.g. Football)
- News and Announcements (e.g. Yearbook and Class Supply List Details)
- Graduate and Alumni Events (e.g. Organizing Class Reunions)
Navigation
Can't Find What You Are Looking For?
Rankings
Nearby Cities
Sponsored Links
K-12 Articles

Teaching Children a Love of History
Parents and grandparents are responsible for teaching children a love of history. To begin, relate...
Parents and grandparents are responsible for teaching children a love of history. To begin, relate...

Homework Helps
School has started throughout the country and is well into the first month-some schools are...
School has started throughout the country and is well into the first month-some schools are...

When Bad Report Cards Happen to Good Kids
It’s mid-term season once again, and semester (or quarter or trimester) grades will be coming out...
It’s mid-term season once again, and semester (or quarter or trimester) grades will be coming out...