Hardin-Jefferson High School
Rating
Not Available
Not Available

5 out of 5 | 1 Review
Find Old Friends From Hardin-Jefferson High School
Use the form below to search for alumni from Hardin-Jefferson High School.
School Description
School Summary and Highlights
- Enrolls 582 high school students from grades 9-12
- Ranks 247th out of 1,325 high schools in TX.
- 2010 Overall School AYP Met Status: Yes
Additional Contact Information
- Mailing Address: P O Box 639, Sour Lake, TX 77659
- Principal or Admin: Mr Joel Nolte
- Fax: (409) 287-2558
- Website: www.hjisd.net
School District Details
- Hardin-Jefferson Independent School District (ISD)
- Per-Pupil Spending: $8,677
- Graduation Rate: 76.5%
- Dropout Rate: 1.4%
- Students Per Teacher: 12.6
- Enrolled Students: 2,014
Faculty Details and Student Enrollment
Students and Faculty
- Total Students Enrolled: 582
- Total Full Time "Equivalent" Teachers: 49.0
- Average Student-To-Teacher Ratio: 11.9
Students Gender Breakdown
- Males: 312 (53.6%)
- Females: 270 (46.4%)
Free Lunch Student Eligibility Breakdown
- Eligible for Reduced Lunch: 45 (7.7%)
- Eligible for Free Lunch: 123 (21.1%)
- Eligible for Either Reduced or Free Lunch: 168 (28.9%)
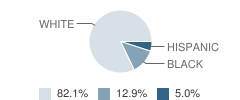
Student Enrollment Distribution by Race / Ethnicity
| Number | Percent | |
|---|---|---|
| American Indian | - | - |
| Black | 75 | 12.9% |
| Asian | - | - |
| Hispanic | 29 | 5.0% |
| White | 478 | 82.1% |
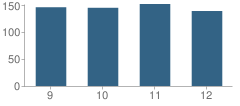
Number of Students Per Grade
| Number | Percent | |
|---|---|---|
| 9th Grade | 146 | 25.1% |
| 10th Grade | 145 | 24.9% |
| 11th Grade | 152 | 26.1% |
| 12th Grade | 139 | 23.9% |
Breakdown of College Ready Graduates (2009)
Percent Ready For College in Reading
School:
70.0%
District:
70.0%
State:
62.0%
Percent Ready For College in Math
School:
85.0%
District:
56.0%
State:
60.0%
Graduation & Dropout Rates (2009)
Graduation Rate
School:
91.8%
District:
91.8%
State:
80.6%
Dropout Rate
School:
4.9%
District:
4.9%
State:
9.4%
Faculty Salary (2010)
School Administration Average Base Salary
School:
$66,156
District:
$65,093
State:
$70,209
Teacher Average Base Salary
School:
$42,161
District:
$42,307
State:
$48,263
Beginning Teacher Average Base Salary
School:
$33,252
District:
$33,882
State:
$41,165
Teacher With 1-5 Years Experience Average Base Salary
School:
$35,635
State:
$43,527
Teacher With 6-10 Years Experience Average Base Salary
School:
$37,778
State:
$46,149
Teacher With 11-20 Years Experience Average Base Salary
School:
$45,362
State:
$50,153
Teacher With Greater Than 20 Years Experience Average Base Salary
School:
$51,536
State:
$58,427
Faculty Breakdown (2010)
Average Teacher Experience
School:
12.7
District:
13.1
State:
11.3
Percent of Teachers With 1-5 Years Experience
School:
21.9%
District:
21.2%
State:
31.0%
Percent of Teachers With 6-10 Years Experience
School:
20.4%
District:
19.9%
State:
20.3%
Percent of Teachers With 11-20 Years Experience
School:
30.9%
District:
32.3%
State:
24.4%
Percent of Teachers With Greater Than 20 Years Experience
School:
20.4%
District:
23.5%
State:
18.3%
Source: TX Department of Education, Source: NCES 2009-2010
School Ratings and Reviews
Overall Rating: 5

5 out of 5 | 1 Review
The Overall Rating is the school's average rating from parents, students, school faculty and staff. The highest rating is five apples and the lowest is one apple.
Share Your Review About This School
1 review for Hardin-Jefferson High School
- Reviewed by Parent/Guardian on December 05, 2009
- Rating:
 (5 / 5) Flag as inappropriate
 - This school has produced efficient, well rounded, and creative students time and again without fail. They have provided the students the opportunity to be themselves without punishment, thereby improving self esteem and confidence in the future generations!
School Map and Similar Schools Nearby
Click to Activate Map of Nearby School Campuses
Private
Public
This School
Similar Schools Nearby
| Devers Junior High School 6-8 | 53 Students | 7.8 miles away | Not Yet Rated | |
| West Brook Sr High School 9-12 | 2,463 Students | 13.0 miles away |  3 out of 5 | |
| West Hardin High School 9-12 | 167 Students | 13.1 miles away |  4 out of 5 | |
| Lumberton High School 9-12 | 1,062 Students | 14.3 miles away | Not Yet Rated | |
| Hull-Daisetta Junior High School 7-8 | 75 Students | 14.4 miles away | Not Yet Rated | |
| Hull-Daisetta High School 9-12 | 164 Students | 14.4 miles away | 3 out of 5 | |
| Central High School 9-12 | 1,596 Students | 17.0 miles away | Not Yet Rated | |
| Kountze High School 9-12 | 382 Students | 17.4 miles away | Not Yet Rated | |
| Ozen High School 9-12 | 1,205 Students | 17.8 miles away |  5 out of 5 | |
| Hamshire-Fannett High School 9-12 | 544 Students | 19.1 miles away | Not Yet Rated | |
Compare This School To Nearby Schools ->
School Community Forum

Join a discussion about Hardin-Jefferson High School and talk to others in the community including students, parents, teachers, and administrators.
Popular Discussion Topics
- Admissions and Registration Questions (e.g. Dress Code and Discipline Policy)
- School Calendar and Upcoming Events (e.g. Graduation)
- After School Programs, Extracurricular Activities, and Athletics (e.g. Football)
- News and Announcements (e.g. Yearbook and Class Supply List Details)
- Graduate and Alumni Events (e.g. Organizing Class Reunions)
Navigation
Can't Find What You Are Looking For?
Nearby Cities
Sponsored Links
K-12 Articles

Tips for Easing Your Child's Back to School Stress
Do you remember the roller coaster of emotions that you experienced as a child when the day for...
Do you remember the roller coaster of emotions that you experienced as a child when the day for...

Your Child and School Corporal Punishment
Your child comes home at the end of the school day with a huge bruise on his upper arm. When you...
Your child comes home at the end of the school day with a huge bruise on his upper arm. When you...

The Cervical Cancer Vaccine
All across North America girls between the ages of 11 and 12 have the opportunity to be vaccinated...
All across North America girls between the ages of 11 and 12 have the opportunity to be vaccinated...