Milford School
Rating
Not Available
Not Available

No Reviews Yet
Find Old Friends From Milford School
Use the form below to search for alumni from Milford School.
School Description
School Summary and Highlights
- Enrolls 254 school students from grades PK-12
- Ranks 535th out of 1,325 high schools in TX.
- 2010 Overall School AYP Met Status: Yes
Additional Contact Information
- Mailing Address: P O Box 545, Milford, TX 76670
- Principal or Admin: Marilee Byrne
- Fax: (972) 493-4600
- Website: www.milfordisd.org
School Operational Details
- Title I EligibleAll students of this school are eligible for participation in authorized programs.
School District Details
- Milford Independent School District (ISD)
- Per-Pupil Spending: $10,250
- Graduation Rate: 93.3%
- Students Per Teacher: 11.6
- Enrolled Students: 254
Faculty Details and Student Enrollment
Students and Faculty
- Total Students Enrolled: 254
- Total Full Time "Equivalent" Teachers: 22.0
- Average Student-To-Teacher Ratio: 11.6
Students Gender Breakdown
- Males: 138 (54.3%)
- Females: 116 (45.7%)
Free Lunch Student Eligibility Breakdown
- Eligible for Reduced Lunch: 25 (9.8%)
- Eligible for Free Lunch: 172 (67.7%)
- Eligible for Either Reduced or Free Lunch: 197 (77.6%)
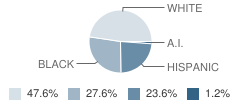
Student Enrollment Distribution by Race / Ethnicity
| Number | Percent | |
|---|---|---|
| American Indian | 3 | 1.2% |
| Black | 70 | 27.6% |
| Asian | - | - |
| Hispanic | 60 | 23.6% |
| White | 121 | 47.6% |
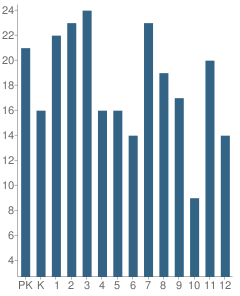
Number of Students Per Grade
| Number | Percent | |
|---|---|---|
| Pre-Kindergarten | 21 | 8.3% |
| Kindergarten | 16 | 6.3% |
| 1st Grade | 22 | 8.7% |
| 2nd Grade | 23 | 9.1% |
| 3rd Grade | 24 | 9.4% |
| 4th Grade | 16 | 6.3% |
| 5th Grade | 16 | 6.3% |
| 6th Grade | 14 | 5.5% |
| 7th Grade | 23 | 9.1% |
| 8th Grade | 19 | 7.5% |
| 9th Grade | 17 | 6.7% |
| 10th Grade | 9 | 3.5% |
| 11th Grade | 20 | 7.9% |
| 12th Grade | 14 | 5.5% |
Breakdown of College Ready Graduates (2009)
Percent Ready For College in Reading
School:
56.0%
District:
56.0%
State:
62.0%
Percent Ready For College in Math
School:
67.0%
State:
60.0%
Graduation & Dropout Rates (2009)
Graduation Rate
School:
81.8%
District:
81.8%
State:
80.6%
Dropout Rate
School:
18.2%
District:
18.2%
State:
9.4%
Faculty Breakdown (2010)
Average Teacher Experience
School:
12.0
District:
12.0
State:
11.3
Percent of Teachers With 1-5 Years Experience
School:
36.4%
District:
36.4%
State:
31.0%
Percent of Teachers With 6-10 Years Experience
School:
18.2%
District:
18.2%
State:
20.3%
Percent of Teachers With 11-20 Years Experience
School:
13.6%
District:
13.6%
State:
24.4%
Percent of Teachers With Greater Than 20 Years Experience
School:
27.3%
District:
27.3%
State:
18.3%
Faculty Salary (2010)
School Administration Average Base Salary
School:
$66,191
District:
$66,191
State:
$70,209
Teacher Average Base Salary
School:
$40,815
District:
$40,815
State:
$48,263
Beginning Teacher Average Base Salary
School:
$29,733
District:
$29,733
State:
$41,165
Teacher With 1-5 Years Experience Average Base Salary
School:
$35,216
State:
$43,527
Teacher With 6-10 Years Experience Average Base Salary
School:
$38,418
State:
$46,149
Teacher With 11-20 Years Experience Average Base Salary
School:
$45,063
State:
$50,153
Teacher With Greater Than 20 Years Experience Average Base Salary
School:
$49,603
State:
$58,427
Source: TX Department of Education, Source: NCES 2009-2010
School Ratings and Reviews
Be The First To Review Milford School!
School Map and Similar Schools Nearby
Click to Activate Map of Nearby School Campuses
Private
Public
This School
Similar Schools Nearby
| Italy High School 7-12 | 302 Students | 5.9 miles away | Not Yet Rated | |
| Frost High School 6-12 | 178 Students | 8.3 miles away | Not Yet Rated | |
| Bynum School PK-12 | 233 Students | 10.9 miles away | Not Yet Rated | |
| Avalon School PK-12 | 332 Students | 10.9 miles away | Not Yet Rated | |
| Itasca High School 9-12 | 186 Students | 11.8 miles away |  1 out of 5 | |
| Itasca Junior High School 5-8 | 227 Students | 11.9 miles away | Not Yet Rated | |
| Hillsboro Junior High School 7-8 | 237 Students | 13.0 miles away | Not Yet Rated | |
| Hillsboro High School 9-12 | 450 Students | 13.8 miles away | Not Yet Rated | |
| Maypearl Junior High School 7-8 | 187 Students | 13.9 miles away | Not Yet Rated | |
| Maypearl High School 9-12 | 319 Students | 13.9 miles away | 1 out of 5 | |
Compare This School To Nearby Schools ->
School Community Forum

Join a discussion about Milford School and talk to others in the community including students, parents, teachers, and administrators.
Popular Discussion Topics
- Admissions and Registration Questions (e.g. Dress Code and Discipline Policy)
- School Calendar and Upcoming Events (e.g. Graduation)
- After School Programs, Extracurricular Activities, and Athletics (e.g. Football)
- News and Announcements (e.g. Yearbook and Class Supply List Details)
- Graduate and Alumni Events (e.g. Organizing Class Reunions)
Navigation
Can't Find What You Are Looking For?
Nearby Cities
Sponsored Links
K-12 Articles

Teaching Children a Love of History
Parents and grandparents are responsible for teaching children a love of history. To begin, relate...
Parents and grandparents are responsible for teaching children a love of history. To begin, relate...

Just a Harmless Vanilla Bean?
Some of the greatest, most used, and most profitable breakthroughs in science have not been made by...
Some of the greatest, most used, and most profitable breakthroughs in science have not been made by...

Parent-Teacher Conference Dos and Don'ts
Finals are over and done, and grades have arrived. Now comes the dreaded time to discuss the...
Finals are over and done, and grades have arrived. Now comes the dreaded time to discuss the...