Pennington Middle School
Rating
Not Available
Not Available

No Reviews Yet
Find Old Friends From Pennington Middle School
Use the form below to search for alumni from Pennington Middle School.
School Description
School Summary and Highlights
- Enrolls 337 middle school students from grades 6-8
- Ranks 214th out of 419 middle schools in VA.
School Operational Details
- Title I EligibleAll students of this school are eligible for participation in authorized programs.
School District Details
- Lee County Public Schools District
- Per-Pupil Spending: $11,127
- Graduation Rate: 57.7%
- Dropout Rate: 4.2%
- Students Per Teacher: 17.8
- Enrolled Students: 3,651
Faculty Details and Student Enrollment
Students and Faculty
- Total Students Enrolled: 337
- Total Full Time "Equivalent" Teachers: 18.1
- Average Student-To-Teacher Ratio: 18.7
Students Gender Breakdown
- Males: 183 (54.3%)
- Females: 154 (45.7%)
Free Lunch Student Eligibility Breakdown
- Eligible for Reduced Lunch: 40 (11.9%)
- Eligible for Free Lunch: 176 (52.2%)
- Eligible for Either Reduced or Free Lunch: 216 (64.1%)
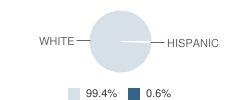
Student Enrollment Distribution by Race / Ethnicity
| Number | Percent | |
|---|---|---|
| American Indian | - | - |
| Black | - | - |
| Asian | - | - |
| Hispanic | 2 | 0.6% |
| White | 335 | 99.4% |
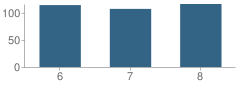
Number of Students Per Grade
| Number | Percent | |
|---|---|---|
| 6th Grade | 114 | 33.8% |
| 7th Grade | 107 | 31.8% |
| 8th Grade | 116 | 34.4% |
Source: VA Department of Education, Source: NCES 2009-2010
School Ratings and Reviews
Be The First To Review Pennington Middle School!
School Map and Similar Schools Nearby
Click to Activate Map of Nearby School Campuses
Private
Public
This School
Similar Schools Nearby
| St. Charles Elementary School PK-7 | 169 Students | 3.6 miles away | Not Yet Rated | |
| Stickleyville Elementary School PK-7 | 94 Students | 4.8 miles away | Not Yet Rated | |
| Keokee Elementary School PK-7 | 78 Students | 7.2 miles away | Not Yet Rated | |
| Jonesville Middle School 6-8 | 263 Students | 11.6 miles away |  4.5 out of 5 | |
| Powell Valley Middle School 5-8 | 520 Students | 17.7 miles away | Not Yet Rated | |
| Rye Cove High School 8-12 | 303 Students | 18.1 miles away |  5 out of 5 | |
| Rye Cove Int. School 5-7 | 192 Students | 18.1 miles away | Not Yet Rated | |
| Rose Hill Elementary School PK-7 | 208 Students | 23.2 miles away | Not Yet Rated | |
| Yuma Elementary School PK-6 | 190 Students | 23.7 miles away | 5 out of 5 | |
| J. I. Burton High School 8-12 | 322 Students | 24.1 miles away |  3 out of 5 | |
Compare This School To Nearby Schools ->
School Community Forum

Join a discussion about Pennington Middle School and talk to others in the community including students, parents, teachers, and administrators.
Popular Discussion Topics
- Admissions and Registration Questions (e.g. Dress Code and Discipline Policy)
- School Calendar and Upcoming Events (e.g. Graduation)
- After School Programs, Extracurricular Activities, and Athletics (e.g. Football)
- News and Announcements (e.g. Yearbook and Class Supply List Details)
- Graduate and Alumni Events (e.g. Organizing Class Reunions)
Navigation
Can't Find What You Are Looking For?
Rankings
Nearby Cities
Sponsored Links
K-12 Articles

What to Do when Your Student is Held Back
Kids develop at different speeds, and everyone has different skills and abilities. School is easy...
Kids develop at different speeds, and everyone has different skills and abilities. School is easy...

Helping Your Learning Disabled Child
Thousands of children in America struggle to learn on a daily basis. Many of them have invisible...
Thousands of children in America struggle to learn on a daily basis. Many of them have invisible...

The Impact on Adopted Children at School
Children who are adopted can be affected both academically and socially at school. Many times...
Children who are adopted can be affected both academically and socially at school. Many times...