Yorkshire Elementary School
Rating
Not Available
Not Available

No Reviews Yet
Find Old Friends From Yorkshire Elementary School
Use the form below to search for alumni from Yorkshire Elementary School.
School Description
School Summary and Highlights
- Enrolls 745 preschool and elementary school students from grades PK-5
- Ranks 1064th out of 1,149 elementary schools in VA.
School Operational Details
- Title I Eligible
School District Details
- Prince William County Public Schools District
- Per-Pupil Spending: $10,372
- Graduation Rate: 78.8%
- Dropout Rate: 2.1%
- Students Per Teacher: 19.3
- Enrolled Students: 76,861
Faculty Details and Student Enrollment
Students and Faculty
- Total Students Enrolled: 745
- Total Full Time "Equivalent" Teachers: 50.5
- Average Student-To-Teacher Ratio: 14.8
Students Gender Breakdown
- Males: 336 (45.1%)
- Females: 367 (49.3%)
Free Lunch Student Eligibility Breakdown
- Eligible for Reduced Lunch: 88 (11.8%)
- Eligible for Free Lunch: 429 (57.6%)
- Eligible for Either Reduced or Free Lunch: 517 (69.4%)
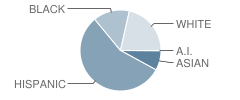
Student Enrollment Distribution by Race / Ethnicity
| Number | Percent | |
|---|---|---|
| American Indian | 1 | 0.1% |
| Black | 102 | 13.7% |
| Asian | 55 | 7.4% |
| Hispanic | 394 | 52.9% |
| White | 151 | 20.3% |
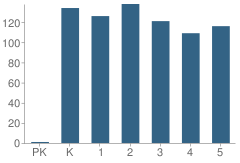
Number of Students Per Grade
| Number | Percent | |
|---|---|---|
| Pre-Kindergarten | 1 | 0.1% |
| Kindergarten | 134 | 18.0% |
| 1st Grade | 126 | 16.9% |
| 2nd Grade | 138 | 18.5% |
| 3rd Grade | 121 | 16.2% |
| 4th Grade | 109 | 14.6% |
| 5th Grade | 116 | 15.6% |
Source: VA Department of Education, Source: NCES 2009-2010
School Ratings and Reviews
Be The First To Review Yorkshire Elementary School!
School Map and Similar Schools Nearby
Click to Activate Map of Nearby School Campuses
Private
Public
This School
Similar Schools Nearby
| Loch Lomond Elementary School PK-5 | 361 Students | 1.1 miles away | Not Yet Rated | |
| Sudley Elementary School PK-5 | 447 Students | 1.5 miles away | Not Yet Rated | |
| Weems Elementary School PK-4 | 594 Students | 1.7 miles away |  5 out of 5 | |
| West Gate Elementary School PK-5 | 584 Students | 2.1 miles away | Not Yet Rated | |
| Centreville Elementary School PK-6 | 925 Students | 2.2 miles away | 5 out of 5 | |
| C. A. Sinclair Elementary School PK-5 | 684 Students | 2.5 miles away | Not Yet Rated | |
| Richard C. Haydon Elementary School KG-4 | 582 Students | 2.6 miles away | 5 out of 5 | |
| Manassas Park Elementary School 3-5 | 676 Students | 2.7 miles away | Not Yet Rated | |
| Cougar Elementary School PK-2 | 716 Students | 2.7 miles away | Not Yet Rated | |
| Pennington School 1-8 | 630 Students | 2.7 miles away | 5 out of 5 | |
Compare This School To Nearby Schools ->
School Community Forum

Join a discussion about Yorkshire Elementary School and talk to others in the community including students, parents, teachers, and administrators.
Popular Discussion Topics
- Admissions and Registration Questions (e.g. Dress Code and Discipline Policy)
- School Calendar and Upcoming Events (e.g. Graduation)
- After School Programs, Extracurricular Activities, and Athletics (e.g. Football)
- News and Announcements (e.g. Yearbook and Class Supply List Details)
- Graduate and Alumni Events (e.g. Organizing Class Reunions)
Navigation
Can't Find What You Are Looking For?
Rankings
Nearby Cities
Sponsored Links
K-12 Articles

Kids and Competition
In the backyard, the classroom, the community and while participating in sports and other...
In the backyard, the classroom, the community and while participating in sports and other...

What to Do when Your Child Hates School
All kids grumble about going to school at one time or another. This is perfectly normal, but what...
All kids grumble about going to school at one time or another. This is perfectly normal, but what...

Nothing New Under the Sun
"I had to go through the same thing when I went to school." Every parent has uttered this phrase,...
"I had to go through the same thing when I went to school." Every parent has uttered this phrase,...