Loch Lomond Elementary School
Rating
Not Available
Not Available

No Reviews Yet
Find Old Friends From Loch Lomond Elementary School
Use the form below to search for alumni from Loch Lomond Elementary School.
School Description
School Summary and Highlights
- Enrolls 361 preschool and elementary school students from grades PK-5
- Ranks 485th out of 1,149 elementary schools in VA.
School Operational Details
- Title I EligibleAll students of this school are eligible for participation in authorized programs.
School District Details
- Prince William County Public Schools District
- Per-Pupil Spending: $10,372
- Graduation Rate: 78.8%
- Dropout Rate: 2.1%
- Students Per Teacher: 19.3
- Enrolled Students: 76,861
Faculty Details and Student Enrollment
Students and Faculty
- Total Students Enrolled: 361
- Total Full Time "Equivalent" Teachers: 25.5
- Average Student-To-Teacher Ratio: 14.2
Students Gender Breakdown
- Males: 184 (51.0%)
- Females: 166 (46.0%)
Free Lunch Student Eligibility Breakdown
- Eligible for Reduced Lunch: 42 (11.6%)
- Eligible for Free Lunch: 214 (59.3%)
- Eligible for Either Reduced or Free Lunch: 256 (70.9%)
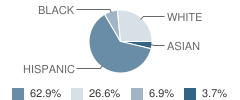
Student Enrollment Distribution by Race / Ethnicity
| Number | Percent | |
|---|---|---|
| American Indian | - | - |
| Black | 24 | 6.6% |
| Asian | 13 | 3.6% |
| Hispanic | 220 | 60.9% |
| White | 93 | 25.8% |
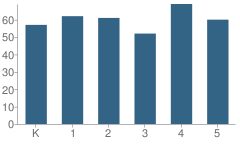
Number of Students Per Grade
| Number | Percent | |
|---|---|---|
| Kindergarten | 57 | 15.8% |
| 1st Grade | 62 | 17.2% |
| 2nd Grade | 61 | 16.9% |
| 3rd Grade | 52 | 14.4% |
| 4th Grade | 69 | 19.1% |
| 5th Grade | 60 | 16.6% |
Source: VA Department of Education, Source: NCES 2009-2010
School Ratings and Reviews
Be The First To Review Loch Lomond Elementary School!
School Map and Similar Schools Nearby
Click to Activate Map of Nearby School Campuses
Private
Public
This School
Similar Schools Nearby
| Sudley Elementary School PK-5 | 447 Students | 0.7 miles away | Not Yet Rated | |
| West Gate Elementary School PK-5 | 584 Students | 1.0 miles away | Not Yet Rated | |
| Yorkshire Elementary School PK-5 | 745 Students | 1.1 miles away | Not Yet Rated | |
| C. A. Sinclair Elementary School PK-5 | 684 Students | 1.4 miles away | Not Yet Rated | |
| Weems Elementary School PK-4 | 594 Students | 1.5 miles away |  5 out of 5 | |
| Richard C. Haydon Elementary School KG-4 | 582 Students | 1.7 miles away | 5 out of 5 | |
| Suella G. Ellis Elementary School PK-5 | 772 Students | 1.9 miles away | Not Yet Rated | |
| Pennington School 1-8 | 630 Students | 2.1 miles away | 5 out of 5 | |
| Jennie Dean Elementary School PK-4 | 546 Students | 2.6 miles away | Not Yet Rated | |
| Mayfield Intermediate School 5-6 | 1,057 Students | 2.7 miles away | 5 out of 5 | |
Compare This School To Nearby Schools ->
School Community Forum

Join a discussion about Loch Lomond Elementary School and talk to others in the community including students, parents, teachers, and administrators.
Popular Discussion Topics
- Admissions and Registration Questions (e.g. Dress Code and Discipline Policy)
- School Calendar and Upcoming Events (e.g. Graduation)
- After School Programs, Extracurricular Activities, and Athletics (e.g. Football)
- News and Announcements (e.g. Yearbook and Class Supply List Details)
- Graduate and Alumni Events (e.g. Organizing Class Reunions)
Navigation
Can't Find What You Are Looking For?
Rankings
Nearby Cities
Sponsored Links
K-12 Articles

Assisting Students to Overcome Test Anxiety
Every human copes with anxiety at one time or another. It is a basic emotion that we feel when...
Every human copes with anxiety at one time or another. It is a basic emotion that we feel when...

Homework Tips: Taking the Work out of Homework
Kids hate homework. It seems that almost every night of the week they are overloaded with...
Kids hate homework. It seems that almost every night of the week they are overloaded with...

Keep Kids Learning All Summer
Early in the 20th century schools in urban districts operated all year `round. However, in rural...
Early in the 20th century schools in urban districts operated all year `round. However, in rural...