Hollywood High School
1521 North Highland Ave, Los Angeles, CA 90028 | (323) 993-1700
- Grades: 9-12
- Student Enrollment: 1,677

5 out of 5 | 1 Review
Find Old Friends From Hollywood High School
Use the form below to search for alumni from Hollywood High School.
School Description
School Summary and Highlights
- Enrolls 1,677 high school students from grades 9-12
- Ranks 715th out of 1,197 high schools in CA.
- 2010 Overall School AYP Met Status: No
Additional Contact Information
- Mailing Address: 1521 North Highland Ave., Los Angeles, CA 90028
School Operational Details
- Title I EligibleAll students of this school are eligible for participation in authorized programs.
School District Details
- Los Angeles Unified School District
- Per-Pupil Spending: $11,357
- Graduation Rate: 48.8%
- Dropout Rate: 6.8%
- Students Per Teacher: 21.3
- Enrolled Students: 667,870
Faculty Details and Student Enrollment
Students and Faculty
- Total Students Enrolled: 1,677
- Total Full Time "Equivalent" Teachers: 84.4
- Average Student-To-Teacher Ratio: 19.9
Students Gender Breakdown
- Males: 781 (46.6%)
- Females: 896 (53.4%)
Free Lunch Student Eligibility Breakdown
- Eligible for Reduced Lunch: 129 (7.7%)
- Eligible for Free Lunch: 1,145 (68.3%)
- Eligible for Either Reduced or Free Lunch: 1,274 (76.0%)
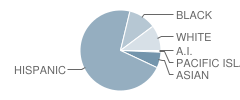
Student Enrollment Distribution by Race / Ethnicity

| Number | Percent | |
|---|---|---|
| American Indian | 8 | 0.5% |
| Black | 183 | 10.9% |
| Asian | 106 | 6.3% |
| Hispanic | 1,179 | 70.3% |
| White | 170 | 10.1% |
Number of Students Per Grade

| Number | Percent | |
|---|---|---|
| 8th Grade | 2 | 0.1% |
| 9th Grade | 530 | 31.6% |
| 10th Grade | 370 | 22.1% |
| 11th Grade | 423 | 25.2% |
| 12th Grade | 352 | 21.0% |
Graduates Information (2010)
Graduation Rate
School:
74.9%
District:
69.1%
State:
78.6%
Teacher Education Background (2009)
Percent With Ph.D.
School:
1.6%
District:
3.7%
Percent With Master's Degree
School:
15.6%
District:
26.9%
Percent With Bachelor's Degree
School:
10.9%
District:
31.9%
Teacher Credentials & Experience (2009)
Percent of Teachers With Emergency Credentials: 1.0%
Percent of Teachers With Credentials: 99.0%
Number of Certificated Staff: 128.0
Average Number of Years of Teacher Experience: 13.5
Average Age
School:
45.9
District:
46.7
Source: CA Department of Education, Source: NCES 2009-2010
Sponsored Links
Test Scores and Performance Information
Overall School Rating
How is this determined?
The overall school rating shows that Hollywood High School performed on average about the same as other schools across the state on CST state exams in the following subjects:
- CST Algebra I
- CST Algebra II
- CST Biology
- CST Chemistry
- CST English-Language Arts
- CST Geometry
- CST Integrated/Coordinated Science
- CST Physics
- CST Science
- CST Summative High School Math
- CST U.S. History
- CST World History
AYP Results (2010)
Overall AYP Met: No
ELA AYP Met: No
Math AYP Met: No
Program Improvement (PI) Requirement Under NCLB (2010)
First Year PI Requirement was Implemented: 1997-1998
School's Placement Under NCLB: Year 5
ACT Exam Results (2009)
Percent of Students Taking ACT Exam: 12.2%
Average Combined Score: 18.3
Percent Scoring At or Above 21: 20.3%
SAT Exam Results (2009)
Percent of Students Taking SAT Exam: 34.9%
Average Combined Score: 1,318.5
Critical Reading Average: 442.5
Math Average: 429.3
Writing Average: 446.7
Percent Scoring At or Above 1500: 23.0%
CST - Test Proficiency by Grade and Subject
Grade 9 - % of students at or above proficiency
| School | District | State | |
|---|---|---|---|
| CST Algebra I Test | |||
| 2010 | 13.0% | 11.0% | 22.0% |
| 2009 | 9.0% | 10.0% | 21.0% |
| 2008 | 6.0% | 9.0% | 18.0% |
| CST Algebra II Test | |||
| 2010 | 31.0% | 42.0% | 69.0% |
| 2009 | 40.0% | 36.0% | 65.0% |
| 2008 | 23.0% | 36.0% | 66.0% |
| CST Biology Test | |||
| 2010 | 48.0% | 27.0% | 55.0% |
| 2009 | 42.0% | 23.0% | 51.0% |
| 2008 | 28.0% | 25.0% | 52.0% |
| CST English-Language Arts Test | |||
| 2010 | 55.0% | 36.0% | 54.0% |
| 2009 | 40.0% | 32.0% | 50.0% |
| 2008 | 28.0% | 31.0% | 49.0% |
| CST Geometry Test | |||
| 2010 | 41.0% | 21.0% | 46.0% |
| 2009 | 23.0% | 23.0% | 47.0% |
| 2008 | 18.0% | 19.0% | 43.0% |
| CST Integrated/Coordinated Science Test | |||
| 2010 | 8.0% | 13.0% | 19.0% |
| 2009 | 3.0% | 9.0% | 15.0% |
| 2008 | 3.0% | 7.0% | 5.0% |
| CST World History Test | |||
| 2010 | 34.0% | 21.0% | 45.0% |
| 2009 | 41.0% | 18.0% | 41.0% |
| 2008 | 14.0% | 15.0% | 36.0% |
Grade 10 - % of students at or above proficiency
| School | District | State | |
|---|---|---|---|
| CST Algebra II Test | |||
| 2010 | 27.0% | 21.0% | 40.0% |
| 2009 | 24.0% | 18.0% | 37.0% |
| 2008 | 7.0% | 17.0% | 36.0% |
| CST Biology Test | |||
| 2010 | 27.0% | 29.0% | 38.0% |
| 2009 | 27.0% | 24.0% | 34.0% |
| 2008 | 14.0% | 23.0% | 35.0% |
| CST Chemistry Test | |||
| 2010 | 29.0% | 17.0% | 47.0% |
| 2009 | 30.0% | 15.0% | 44.0% |
| 2008 | 14.0% | 13.0% | 41.0% |
| CST English-Language Arts Test | |||
| 2010 | 45.0% | 33.0% | 45.0% |
| 2009 | 46.0% | 31.0% | 44.0% |
| 2008 | 27.0% | 29.0% | 41.0% |
| CST Geometry Test | |||
| 2010 | 10.0% | 6.0% | 14.0% |
| 2009 | 7.0% | 6.0% | 14.0% |
| 2008 | 3.0% | 5.0% | 12.0% |
| CST Integrated/Coordinated Science Test | |||
| 2010 | 5.0% | 6.0% | 14.0% |
| 2009 | 7.0% | 1.0% | 9.0% |
| 2008 | 1.0% | 2.0% | 7.0% |
| CST Science Test | |||
| 2010 | 42.0% | 32.0% | 46.0% |
| 2009 | 46.0% | 30.0% | 44.0% |
| 2008 | 19.0% | 25.0% | 40.0% |
| CST Summative High School Math Test | |||
| 2010 | 55.0% | 53.0% | 75.0% |
| 2009 | 29.0% | 42.0% | 71.0% |
| 2008 | 16.0% | 44.0% | 68.0% |
| CST World History Test | |||
| 2010 | 35.0% | 28.0% | 42.0% |
| 2009 | 34.0% | 24.0% | 38.0% |
| 2008 | 17.0% | 19.0% | 33.0% |
| CST Algebra I Test | |||
| 2009 | 9.0% | 6.0% | 11.0% |
Grade 11 - % of students at or above proficiency
| School | District | State | |
|---|---|---|---|
| CST Algebra II Test | |||
| 2010 | 6.0% | 6.0% | 14.0% |
| 2009 | 1.0% | 6.0% | 12.0% |
| 2008 | 2.0% | 5.0% | 11.0% |
| CST Biology Test | |||
| 2010 | 52.0% | 29.0% | 46.0% |
| 2009 | 44.0% | 26.0% | 41.0% |
| 2008 | 36.0% | 26.0% | 39.0% |
| CST Chemistry Test | |||
| 2010 | 25.0% | 15.0% | 30.0% |
| 2009 | 13.0% | 13.0% | 27.0% |
| 2008 | 9.0% | 11.0% | 25.0% |
| CST English-Language Arts Test | |||
| 2010 | 56.0% | 34.0% | 42.0% |
| 2009 | 44.0% | 32.0% | 40.0% |
| 2008 | 28.0% | 27.0% | 37.0% |
| CST Physics Test | |||
| 2010 | 56.0% | 26.0% | 53.0% |
| 2009 | 44.0% | 22.0% | 50.0% |
| 2008 | 30.0% | 19.0% | 47.0% |
| CST Summative High School Math Test | |||
| 2010 | 29.0% | 31.0% | 50.0% |
| 2009 | 11.0% | 27.0% | 47.0% |
| 2008 | 12.0% | 25.0% | 43.0% |
| CST U.S. History Test | |||
| 2010 | 49.0% | 33.0% | 45.0% |
| 2009 | 34.0% | 31.0% | 44.0% |
| 2008 | 23.0% | 25.0% | 38.0% |
| CST World History Test | |||
| 2010 | 46.0% | 14.0% | 15.0% |
| 2009 | 20.0% | 8.0% | 11.0% |
| CST Algebra I Test | |||
| 2009 | 7.0% | 6.0% | 8.0% |
| CST Geometry Test | |||
| 2008 | 2.0% | 2.0% | 6.0% |
| CST Integrated/Coordinated Science Test | |||
| 2008 | 5.0% | 3.0% | 10.0% |
End of Course - % of students at or above proficiency
| School | District | State | |
|---|---|---|---|
| CST Algebra I Test | |||
| 2010 | 11.0% | 22.0% | 31.0% |
| 2009 | 10.0% | 19.0% | 28.0% |
| 2008 | 5.0% | 17.0% | 25.0% |
| CST Algebra II Test | |||
| 2010 | 17.0% | 16.0% | 31.0% |
| 2009 | 17.0% | 15.0% | 28.0% |
| 2008 | 6.0% | 13.0% | 27.0% |
| CST Biology Test | |||
| 2010 | 42.0% | 28.0% | 46.0% |
| 2009 | 36.0% | 24.0% | 42.0% |
| 2008 | 24.0% | 24.0% | 42.0% |
| CST Chemistry Test | |||
| 2010 | 27.0% | 16.0% | 38.0% |
| 2009 | 23.0% | 14.0% | 36.0% |
| 2008 | 12.0% | 12.0% | 32.0% |
| CST Geometry Test | |||
| 2010 | 22.0% | 14.0% | 27.0% |
| 2009 | 13.0% | 14.0% | 26.0% |
| 2008 | 9.0% | 11.0% | 24.0% |
| CST Integrated/Coordinated Science Test | |||
| 2010 | 7.0% | 3.0% | 16.0% |
| 2009 | 3.0% | 7.0% | 13.0% |
| 2008 | 3.0% | 2.0% | 11.0% |
| CST Physics Test | |||
| 2010 | 56.0% | 24.0% | 49.0% |
| 2009 | 44.0% | 20.0% | 46.0% |
| 2008 | 30.0% | 18.0% | 43.0% |
| CST Summative High School Math Test | |||
| 2010 | 31.0% | 35.0% | 54.0% |
| 2009 | 13.0% | 30.0% | 50.0% |
| 2008 | 13.0% | 29.0% | 47.0% |
| CST World History Test | |||
| 2010 | 35.0% | 27.0% | 41.0% |
| 2009 | 36.0% | 23.0% | 38.0% |
| 2008 | 15.0% | 18.0% | 33.0% |
Source: CA Department of Education 2009-2010
School Map and Similar Schools Nearby
Click to Activate Map of Nearby School Campuses
Private
Public
This School
Similar Schools Nearby
| Academic Performance Excellence Academy 9-12 | 304 Students | 1.4 miles away | Not Yet Rated | - |
| Fairfax High School 9-12 | 2,512 Students | 1.6 miles away | Not Yet Rated | |
| Los Angeles High School 9-12 | 2,855 Students | 2.9 miles away | Not Yet Rated | |
| John Marshall High School 9-12 | 3,479 Students | 3.6 miles away | ![]() 5 out of 5 | |
| Beverly Hills High School 9-12 | 2,201 Students | 4.9 miles away | ![]() 5 out of 5 | |
| West Adams Preparatory High School 9-12 | 2,618 Students | 4.9 miles away | Not Yet Rated | - |
| Los Angeles Teachers Preparatory Academy 9-12 | 229 Students | 5.0 miles away | Not Yet Rated | - |
| Academic Leadership Community School 9-12 | 445 Students | 5.2 miles away | Not Yet Rated | - |
| Susan Miller Dorsey High School 9-12 | 1,681 Students | 5.2 miles away | Not Yet Rated | |
| Alexander Hamilton High School 9-12 | 3,083 Students | 5.4 miles away | ![]() 5 out of 5 | |
Compare This School To Nearby Schools ->
School Community Forum

Join a discussion about Hollywood High School and talk to others in the community including students, parents, teachers, and administrators.
Popular Discussion Topics
- Admissions and Registration Questions (e.g. Dress Code and Discipline Policy)
- School Calendar and Upcoming Events (e.g. Graduation)
- After School Programs, Extracurricular Activities, and Athletics (e.g. Football)
- News and Announcements (e.g. Yearbook and Class Supply List Details)
- Graduate and Alumni Events (e.g. Organizing Class Reunions)
Navigation
Can't Find What You Are Looking For?
Rankings
Sponsored Links
K-12 Articles
Changing Schools Isn't Easy: Tips for a Successful Transition
It isn't easy for students to make the transition into a new school, especially if they have...
Keep Your Licensed Teen Safe This Summer
Every year hundreds of teenage drivers lose their lives in motor vehicle accidents. Statistics show...
Teaching Children with Learning Disabilities to Make Friends
Children with learning disabilities often have trouble making and retaining friendships. Some kids...


(5 / 5) 