Robert Louis Stevenson Middle School
Rating
Not Available
Not Available

No Reviews Yet
Find Old Friends From Robert Louis Stevenson Middle School
Use the form below to search for alumni from Robert Louis Stevenson Middle School.
School Description
School Summary and Highlights
- Enrolls 2,120 middle school students from grades 6-8
- Ranks 1925th out of 2,050 middle schools in CA.
- 2010 Overall School AYP Met Status: No
Additional Contact Information
- Mailing Address: 725 South Indiana St., Los Angeles, CA 90023
School Operational Details
- Title I EligibleAll students of this school are eligible for participation in authorized programs.
School District Details
- Los Angeles Unified School District
- Per-Pupil Spending: $11,357
- Graduation Rate: 48.8%
- Dropout Rate: 6.8%
- Students Per Teacher: 21.3
- Enrolled Students: 667,870
Faculty Details and Student Enrollment
Students and Faculty
- Total Students Enrolled: 2,120
- Total Full Time "Equivalent" Teachers: 107.3
- Average Student-To-Teacher Ratio: 19.8
Students Gender Breakdown
- Males: 1,077 (50.8%)
- Females: 1,043 (49.2%)
Free Lunch Student Eligibility Breakdown
- Eligible for Reduced Lunch: 64 (3.0%)
- Eligible for Free Lunch: 1,815 (85.6%)
- Eligible for Either Reduced or Free Lunch: 1,879 (88.6%)
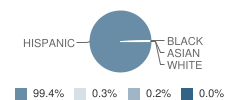
Student Enrollment Distribution by Race / Ethnicity
| Number | Percent | |
|---|---|---|
| American Indian | - | - |
| Black | 5 | 0.2% |
| Asian | 1 | 0.05% |
| Hispanic | 2,108 | 99.4% |
| White | 6 | 0.3% |
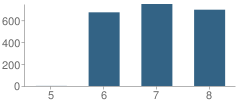
Number of Students Per Grade
| Number | Percent | |
|---|---|---|
| 5th Grade | 1 | 0.05% |
| 6th Grade | 673 | 31.7% |
| 7th Grade | 749 | 35.3% |
| 8th Grade | 697 | 32.9% |
Teacher Education Background (2009)
Percent With Ph.D.
School:
81.3%
District:
3.7%
Percent With Master's Degree
School:
10.6%
District:
26.9%
Percent With Bachelor's Degree
School:
13.8%
District:
31.9%
Teacher Credentials & Experience (2009)
Percent of Teachers With Credentials: 98.1%
Number of Certificated Staff: 123.0
Average Number of Years of Teacher Experience: 11.7
Average Age
School:
41.1
District:
46.7
Source: CA Department of Education, Source: NCES 2009-2010
School Ratings and Reviews
Be The First To Review Robert Louis Stevenson Middle School!
School Map and Similar Schools Nearby
Click to Activate Map of Nearby School Campuses
Private
Public
This School
Similar Schools Nearby
| Belvedere Middle School 6-8 | 1,906 Students | 1.1 miles away | Not Yet Rated | |
| Christopher Dena Elementary School KG-6 | 566 Students | 1.1 miles away | Not Yet Rated | |
| Marianna Avenue Elementary School KG-6 | 482 Students | 1.2 miles away | Not Yet Rated | |
| Malabar Street Elementary School KG-6 | 902 Students | 1.3 miles away | Not Yet Rated | |
| Hollenbeck Middle School 6-8 | 1,722 Students | 1.3 miles away | Not Yet Rated | |
| Soto Street Elementary School KG-6 | 339 Students | 1.5 miles away |  5 out of 5 | |
| Breed Street Elementary School KG-6 | 638 Students | 1.7 miles away | Not Yet Rated | |
| David Wark Griffith Middle School 6-8 | 1,688 Students | 1.7 miles away | Not Yet Rated | |
| Brooklyn Avenue Elementary School KG-6 | 533 Students | 1.8 miles away | Not Yet Rated | |
| Sheridan Street Elementary School KG-6 | 1,189 Students | 1.9 miles away |  4 out of 5 | |
Compare This School To Nearby Schools ->
School Community Forum

Join a discussion about Robert Louis Stevenson Middle School and talk to others in the community including students, parents, teachers, and administrators.
Popular Discussion Topics
- Admissions and Registration Questions (e.g. Dress Code and Discipline Policy)
- School Calendar and Upcoming Events (e.g. Graduation)
- After School Programs, Extracurricular Activities, and Athletics (e.g. Football)
- News and Announcements (e.g. Yearbook and Class Supply List Details)
- Graduate and Alumni Events (e.g. Organizing Class Reunions)
Navigation
Can't Find What You Are Looking For?
Rankings
Nearby Cities
Sponsored Links
K-12 Articles

Idle Hands
The worst affliction affecting our kids today is not teen pregnancy, drugs and alcohol, or...
The worst affliction affecting our kids today is not teen pregnancy, drugs and alcohol, or...

Just a Harmless Vanilla Bean?
Some of the greatest, most used, and most profitable breakthroughs in science have not been made by...
Some of the greatest, most used, and most profitable breakthroughs in science have not been made by...

Parent and Family Involvement in School
When visiting my grandson’s school, I often hear administrators and teachers complaining that not...
When visiting my grandson’s school, I often hear administrators and teachers complaining that not...