Sun Valley Middle School
Rating
Not Available
Not Available

No Reviews Yet
Find Old Friends From Sun Valley Middle School
Use the form below to search for alumni from Sun Valley Middle School.
School Description
School Summary and Highlights
- Enrolls 1,457 middle school students from grades 6-8
- Ranks 1869th out of 2,050 middle schools in CA.
- 2010 Overall School AYP Met Status: No
Additional Contact Information
- Mailing Address: 7330 Bakman Ave., Sun Valley, CA 91352
School Operational Details
- Title I EligibleAll students of this school are eligible for participation in authorized programs.
School District Details
- Los Angeles Unified School District
- Per-Pupil Spending: $11,357
- Graduation Rate: 48.8%
- Dropout Rate: 6.8%
- Students Per Teacher: 21.3
- Enrolled Students: 667,870
Faculty Details and Student Enrollment
Students and Faculty
- Total Students Enrolled: 1,457
- Total Full Time "Equivalent" Teachers: 78.8
- Average Student-To-Teacher Ratio: 18.5
Students Gender Breakdown
- Males: 744 (51.1%)
- Females: 713 (48.9%)
Free Lunch Student Eligibility Breakdown
- Eligible for Reduced Lunch: 48 (3.3%)
- Eligible for Free Lunch: 1,266 (86.9%)
- Eligible for Either Reduced or Free Lunch: 1,314 (90.2%)
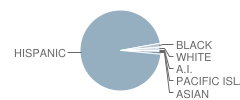
Student Enrollment Distribution by Race / Ethnicity
| Number | Percent | |
|---|---|---|
| American Indian | 2 | 0.1% |
| Black | 22 | 1.5% |
| Asian | 17 | 1.2% |
| Hispanic | 1,388 | 95.3% |
| White | 21 | 1.4% |
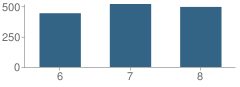
Number of Students Per Grade
| Number | Percent | |
|---|---|---|
| 6th Grade | 443 | 30.4% |
| 7th Grade | 519 | 35.6% |
| 8th Grade | 495 | 34.0% |
Teacher Education Background (2009)
Percent With Ph.D.
School:
2.0%
District:
3.7%
Percent With Master's Degree
School:
12.7%
District:
26.9%
Percent With Bachelor's Degree
School:
15.7%
District:
31.9%
Teacher Credentials & Experience (2009)
Percent of Teachers With Credentials: 96.5%
Number of Certificated Staff: 102.0
Average Number of Years of Teacher Experience: 9.6
Average Age
School:
43.5
District:
46.7
Source: CA Department of Education, Source: NCES 2009-2010
School Ratings and Reviews
Be The First To Review Sun Valley Middle School!
School Map and Similar Schools Nearby
Click to Activate Map of Nearby School Campuses
Private
Public
This School
Similar Schools Nearby
| Roy Romer Middle School 6-8 | 1,423 Students | 1.5 miles away | Not Yet Rated | - |
| Richard E. Byrd Middle School 6-8 | 1,768 Students | 2.1 miles away | Not Yet Rated | |
| Luther Burbank Middle School 6-8 | 1,010 Students | 2.2 miles away |  5 out of 5 | |
| James Madison Middle School 6-8 | 1,609 Students | 2.2 miles away | 5 out of 5 | |
| East Valley Area New High School #1b 8-12 | 1,219 Students | 2.3 miles away | Not Yet Rated | |
| Walter Reed Middle School 6-8 | 1,601 Students | 3.6 miles away | 5 out of 5 | |
| David Starr Jordan Middle School 6-8 | 1,167 Students | 3.8 miles away | 5 out of 5 | |
| John Muir Middle School 6-8 | 1,369 Students | 3.9 miles away | Not Yet Rated | |
| Robert A. Millikan Middle School 6-8 | 2,054 Students | 4.0 miles away | Not Yet Rated | |
| Pacoima Middle School 6-8 | 1,836 Students | 4.1 miles away | 5 out of 5 | |
Compare This School To Nearby Schools ->
School Community Forum

Join a discussion about Sun Valley Middle School and talk to others in the community including students, parents, teachers, and administrators.
Popular Discussion Topics
- Admissions and Registration Questions (e.g. Dress Code and Discipline Policy)
- School Calendar and Upcoming Events (e.g. Graduation)
- After School Programs, Extracurricular Activities, and Athletics (e.g. Football)
- News and Announcements (e.g. Yearbook and Class Supply List Details)
- Graduate and Alumni Events (e.g. Organizing Class Reunions)
Navigation
Can't Find What You Are Looking For?
Rankings
Nearby Cities
Sponsored Links
K-12 Articles

What to Do when Your Student is Held Back
Kids develop at different speeds, and everyone has different skills and abilities. School is easy...
Kids develop at different speeds, and everyone has different skills and abilities. School is easy...

Making Sense of No Child Left Behind
The No Child Left Behind Act of 2001 has met with mixed results and mixed feelings. Some think it...
The No Child Left Behind Act of 2001 has met with mixed results and mixed feelings. Some think it...

Teaching Kids to Deal with Peer Pressure
Parents usually become very concerned when they hear the term "peer pressure." However, peer...
Parents usually become very concerned when they hear the term "peer pressure." However, peer...