Cultural Investigations in A Multicultural Atmosph School
Rating
Not Available
Not Available

No Reviews Yet
Find Old Friends From Cultural Investigations in A Multicultural Atmosph School
Use the form below to search for alumni from Cultural Investigations in a Multicultural Atmosph School.
School Description
School Summary and Highlights
- Enrolls 373 high school students from grades 9-12
- Ranks 1185th out of 1,197 high schools in CA.
- 2010 Overall School AYP Met Status: No
Additional Contact Information
- Mailing Address: 1405 Park Blvd., San Diego, CA 92101
School Operational Details
- Title I EligibleAll students of this school are eligible for participation in authorized programs.
School District Details
- San Diego Unified School District
- Per-Pupil Spending: $10,305
- Graduation Rate: 63.0%
- Dropout Rate: 2.4%
- Students Per Teacher: 20.1
- Enrolled Students: 131,163
Faculty Details and Student Enrollment
Students and Faculty
- Total Students Enrolled: 373
- Total Full Time "Equivalent" Teachers: 17.7
- Average Student-To-Teacher Ratio: 21.1
Students Gender Breakdown
- Males: 180 (48.3%)
- Females: 193 (51.7%)
Free Lunch Student Eligibility Breakdown
- Eligible for Reduced Lunch: 4 (1.1%)
- Eligible for Free Lunch: 362 (97.1%)
- Eligible for Either Reduced or Free Lunch: 366 (98.1%)
Student Enrollment Distribution by Race / Ethnicity
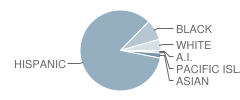
| Number | Percent | |
|---|---|---|
| American Indian | 3 | 0.8% |
| Black | 31 | 8.3% |
| Asian | 8 | 2.1% |
| Hispanic | 311 | 83.4% |
| White | 17 | 4.6% |
Number of Students Per Grade
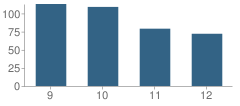
| Number | Percent | |
|---|---|---|
| 9th Grade | 113 | 30.3% |
| 10th Grade | 109 | 29.2% |
| 11th Grade | 79 | 21.2% |
| 12th Grade | 72 | 19.3% |
Graduates Information (2010)
Graduation Rate
School:
33.7%
District:
79.3%
State:
78.6%
Teacher Education Background (2009)
Percent With Bachelor's Degree
School:
44.4%
District:
16.8%
Percent With Master's Degree
School:
50.0%
District:
80.1%
Teacher Credentials & Experience (2009)
Average Age
School:
39.6
District:
46.6
Average Number of Years of Teacher Experience: 10.1
Number of Certificated Staff: 18.0
Percent of Teachers With Credentials: 93.3%
Source: CA Department of Education, Source: NCES 2009-2010
School Ratings and Reviews
Be The First To Review Cultural Investigations in A Multicultural Atmosph School!
School Map and Similar Schools Nearby
Click to Activate Map of Nearby School Campuses
Private
Public
This School
Similar Schools Nearby
| Scitech High School 9-12 | 554 Students | 0 miles away | Not Yet Rated | |
| Coronado High School 9-12 | 1,120 Students | 2.4 miles away | Not Yet Rated | |
| Lincoln High School 9-12 | 2,161 Students | 3.7 miles away | Not Yet Rated | - |
| Hoover High School 9-12 | 2,163 Students | 4.2 miles away | Not Yet Rated | |
| Point Loma High School 9-12 | 2,115 Students | 4.4 miles away | Not Yet Rated | |
| Invention and Design Educational Academy 9-12 | 331 Students | 5.1 miles away | Not Yet Rated | |
| School of International Business at Kearny High Education 9-12 | 454 Students | 5.6 miles away | Not Yet Rated | |
| Morse High School 9-12 | 2,339 Students | 6.2 miles away | Not Yet Rated | |
| San Diego School of Creative and Performing Art 6-12 | 1,427 Students | 6.7 miles away | Not Yet Rated | |
| Mission Bay High School 9-12 | 1,622 Students | 6.9 miles away | Not Yet Rated | |
Compare This School To Nearby Schools ->
School Community Forum

Join a discussion about Cultural Investigations in A Multicultural Atmosph School and talk to others in the community including students, parents, teachers, and administrators.
Popular Discussion Topics
- Admissions and Registration Questions (e.g. Dress Code and Discipline Policy)
- School Calendar and Upcoming Events (e.g. Graduation)
- After School Programs, Extracurricular Activities, and Athletics (e.g. Football)
- News and Announcements (e.g. Yearbook and Class Supply List Details)
- Graduate and Alumni Events (e.g. Organizing Class Reunions)
Navigation
Can't Find What You Are Looking For?
Rankings
Nearby Cities
Sponsored Links
K-12 Articles

What to Do when Your Child Hates School
All kids grumble about going to school at one time or another. This is perfectly normal, but what...
All kids grumble about going to school at one time or another. This is perfectly normal, but what...

Where in the World is Carmen Sandiego?
One of the sensations on YouTube highlights the state of our education system. The spot was...
One of the sensations on YouTube highlights the state of our education system. The spot was...

Break the Cycle: Teen Dating Violence and Prevention Week
February 5 through 9 was “National Teen Dating Violence Awareness and Prevention Week”....
February 5 through 9 was “National Teen Dating Violence Awareness and Prevention Week”....