University Preparatory School
Rating
Not Available
Not Available

5 out of 5 | 1 Review
Find Old Friends From University Preparatory School
Use the form below to search for alumni from University Preparatory School.
School Description
School Summary and Highlights
- Enrolls 983 middle and high school students from grades 7-12
- Ranks 138th out of 1,197 high schools in CA.
- 2010 Overall School AYP Met Status: Yes
- National Blue Ribbon Schools Award 2010

Additional Contact Information
- Mailing Address: 16925 Forrest St., Victorville, CA 92395
School Operational Details
- Title I Eligible
School District Details
- Victor Valley Union High School District
- Per-Pupil Spending: $6,495
- Graduation Rate: 68.1%
- Dropout Rate: 11.4%
- Students Per Teacher: 23.2
- Enrolled Students: 13,993
Faculty Details and Student Enrollment
Students and Faculty
- Total Students Enrolled: 983
- Total Full Time "Equivalent" Teachers: 34.0
- Average Student-To-Teacher Ratio: 28.9
Students Gender Breakdown
- Males: 384 (39.1%)
- Females: 599 (60.9%)
Free Lunch Student Eligibility Breakdown
- Eligible for Reduced Lunch: 195 (19.8%)
- Eligible for Free Lunch: 351 (35.7%)
- Eligible for Either Reduced or Free Lunch: 546 (55.5%)
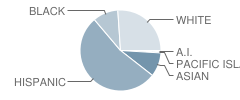
Student Enrollment Distribution by Race / Ethnicity
| Number | Percent | |
|---|---|---|
| American Indian | 6 | 0.6% |
| Black | 100 | 10.2% |
| Asian | 95 | 9.7% |
| Hispanic | 519 | 52.8% |
| White | 255 | 25.9% |
Number of Students Per Grade

| Number | Percent | |
|---|---|---|
| 7th Grade | 198 | 20.1% |
| 8th Grade | 203 | 20.7% |
| 9th Grade | 195 | 19.8% |
| 10th Grade | 161 | 16.4% |
| 11th Grade | 128 | 13.0% |
| 12th Grade | 98 | 10.0% |
Teacher Education Background (2009)
Percent With Ph.D.
School:
6.1%
District:
11.8%
Percent With Master's Degree
School:
18.2%
District:
41.2%
Percent With Bachelor's Degree: 30.3%
Teacher Credentials & Experience (2009)
Percent of Teachers With Credentials: 96.6%
Number of Certificated Staff: 33.0
Average Number of Years of Teacher Experience: 10.6
Average Age
School:
38.2
District:
48.7
Source: CA Department of Education, Source: NCES 2009-2010
School Ratings and Reviews
Overall Rating: 5

5 out of 5 | 1 Review
The Overall Rating is the school's average rating from parents, students, school faculty and staff. The highest rating is five apples and the lowest is one apple.
Share Your Review About This School
1 review for University Preparatory School
- Reviewed by Community Member on October 22, 2008
- Rating:
 (5 / 5) Flag as inappropriate
 - I am looking to apply for a teaching position
School Map and Similar Schools Nearby
Click to Activate Map of Nearby School Campuses
Private
Public
This School
Similar Schools Nearby
| Imogene Garner Hook Junior High School 7-8 | 904 Students | 2.5 miles away |  5 out of 5 | |
| Silverado High School 9-12 | 3,753 Students | 4.8 miles away |  3.5 out of 5 | |
| Hesperia Junior High School 7-8 | 1,137 Students | 6.8 miles away | Not Yet Rated | |
| Apple Valley High School 9-12 | 2,145 Students | 7.5 miles away | 5 out of 5 | |
| Hesperia High School 9-12 | 2,293 Students | 7.6 miles away | 5 out of 5 | |
| Granite Hills High School 9-12 | 2,013 Students | 7.7 miles away | 5 out of 5 | |
| Sultana High School 9-12 | 2,386 Students | 8.3 miles away | Not Yet Rated | |
| Lucerne Valley High School 9-12 | 311 Students | 21.0 miles away |  1 out of 5 | |
| Rim of the World High School 9-12 | 1,402 Students | 21.4 miles away | 3.5 out of 5 | |
| Cajon High School 9-12 | 2,913 Students | 24.7 miles away |  4.5 out of 5 | |
Compare This School To Nearby Schools ->
School Community Forum

Join a discussion about University Preparatory School and talk to others in the community including students, parents, teachers, and administrators.
Popular Discussion Topics
- Admissions and Registration Questions (e.g. Dress Code and Discipline Policy)
- School Calendar and Upcoming Events (e.g. Graduation)
- After School Programs, Extracurricular Activities, and Athletics (e.g. Football)
- News and Announcements (e.g. Yearbook and Class Supply List Details)
- Graduate and Alumni Events (e.g. Organizing Class Reunions)
Navigation
Can't Find What You Are Looking For?
Rankings
Nearby Cities
Sponsored Links
K-12 Articles

Teaching Your Child Study Skills
Many children who have the capability to get good grades experience frustration because of low...
Many children who have the capability to get good grades experience frustration because of low...

Teaching Your Kids About Respect, Values and Violence
These days it seems that every newscast reports at least once incident of violence. As parents, we...
These days it seems that every newscast reports at least once incident of violence. As parents, we...

Helping Your Child Leave the Nest
It's all come down to this: Eighteen years of good times and bad, and now your baby bird is ready...
It's all come down to this: Eighteen years of good times and bad, and now your baby bird is ready...