Patterson High School
Rating
Not Available
Not Available

3 out of 5 | 5 Reviews
Find Old Friends From Patterson High School
Use the form below to search for alumni from Patterson High School.
School Description
School Summary and Highlights
- Enrolls 1,608 high school students from grades 9-12
- Ranks 839th out of 1,197 high schools in CA.
- 2010 Overall School AYP Met Status: No
Additional Contact Information
- Mailing Address: 201 North Seventh St., Patterson, CA 95363
School Operational Details
- Title I Eligible
School District Details
- Patterson Joint Unified School District
- Per-Pupil Spending: $8,132
- Graduation Rate: 80.1%
- Dropout Rate: 3.2%
- Students Per Teacher: 22.2
- Enrolled Students: 5,636
Faculty Details and Student Enrollment
Students and Faculty
- Total Students Enrolled: 1,608
- Total Full Time "Equivalent" Teachers: 66.0
- Average Student-To-Teacher Ratio: 24.4
Students Gender Breakdown
- Males: 812 (50.5%)
- Females: 796 (49.5%)
Free Lunch Student Eligibility Breakdown
- Eligible for Reduced Lunch: 179 (11.1%)
- Eligible for Free Lunch: 647 (40.2%)
- Eligible for Either Reduced or Free Lunch: 826 (51.4%)
Student Enrollment Distribution by Race / Ethnicity
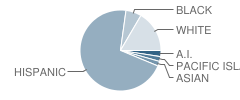
| Number | Percent | |
|---|---|---|
| American Indian | 6 | 0.4% |
| Black | 13 | 0.8% |
| Asian | 5 | 0.3% |
| Hispanic | 132 | 8.2% |
| White | 32 | 2.0% |
Number of Students Per Grade
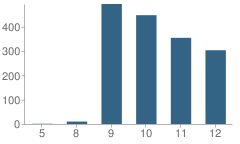
| Number | Percent | |
|---|---|---|
| 5th Grade | 1 | 0.06% |
| 8th Grade | 10 | 0.6% |
| 9th Grade | 493 | 30.7% |
| 10th Grade | 447 | 27.8% |
| 11th Grade | 354 | 22.0% |
| 12th Grade | 303 | 18.8% |
Graduates Information (2010)
Graduation Rate
School:
88.4%
District:
85.5%
State:
78.6%
Teacher Education Background (2009)
Percent With Bachelor's Degree
School:
21.3%
District:
5.9%
Percent With Master's Degree
School:
8.8%
District:
52.9%
Teacher Credentials & Experience (2009)
Average Age
School:
39.9
District:
48.1
Average Number of Years of Teacher Experience: 9.0
Number of Certificated Staff: 80.0
Percent of Teachers With Credentials: 83.3%
Source: CA Department of Education, Source: NCES 2009-2010
School Ratings and Reviews
Overall Rating: 3

3 out of 5 | 5 Reviews
The Overall Rating is the school's average rating from parents, students, school faculty and staff. The highest rating is five apples and the lowest is one apple.
Share Your Review About This School
5 reviews for Patterson High School
- Reviewed by Student on January 01, 2010
- Rating:
 (2 / 5) Flag as inappropriate
 - horrible security no books, food is inedible everything is over priced and expectations are way to high for what they provide
- Reviewed by Former Student on May 12, 2009
- Rating:
 (4 / 5) Flag as inappropriate
 - As an alumni of the class of 09, however, a transfer out of my senior year of 09, I would like to say the coaches are wonderful, Coach Lee, Cozart, and everybody who finally realized that I was a serious football player wanting what eveybody else wanted as a girl. However, my new school, focuses on sports as well, but they are no Coach Lee, and Cozart. Thanks to all my coaches, and friends all four years. And hey Tigers, let's take care of them Raiders. :)
- Reviewed by Student on February 26, 2009
- Rating:
 (3 / 5) Flag as inappropriate
 - As a current student of this school, I would like to point out that the staff here is mostly extremely qualified, with some minor exceptions of course, and are very personable despite the amount of students per class. However, this school spends too much of its money on the athletic department and thus the academia suffers greatly from under funding. Overall, an OK school.
- Reviewed by Former Student on January 08, 2009
- Rating:
 (1 / 5) Flag as inappropriate
 - As a former student I would not recommend this school to anyone. Very under funded, student to teacher ratio sucks, a very poor school. Send your children to a different school.
- Reviewed by Parent/Guardian on September 21, 2007
- Rating:
 (5 / 5) Flag as inappropriate
 - I would like to Thank the Staff at Patterson Hi during the Mishap on Wednesday 9/19/07
I thought they did an excellent job concerning our students. It was unfortunate if students did get hurt but sometimes things just cannot be helped. You deserve a star.
School Map and Similar Schools Nearby
Click to Activate Map of Nearby School Campuses
Private
Public
This School
Similar Schools Nearby
| Orestimba High School 9-12 | 738 Students | 11.9 miles away | Not Yet Rated | |
| Yolo Junior High School 6-8 | 622 Students | 12.3 miles away |  4 out of 5 | |
| Central Valley High School 9-12 | 1,654 Students | 12.3 miles away | Not Yet Rated | |
| Blaker-Kinser Junior High School 7-8 | 813 Students | 12.4 miles away | Not Yet Rated | |
| Mark Twain Junior High School 7-8 | 650 Students | 12.7 miles away | Not Yet Rated | |
| Ceres High School 9-12 | 1,418 Students | 13.0 miles away | 4 out of 5 | |
| Modesto High School 9-12 | 2,933 Students | 13.1 miles away |  4.5 out of 5 | |
| Mae Hensley Junior High School 7-8 | 982 Students | 13.8 miles away |  5 out of 5 | |
| John H. Pitman High School 9-12 | 2,207 Students | 14.8 miles away | Not Yet Rated | |
| Roosevelt Junior High School 7-8 | 717 Students | 15.0 miles away | 5 out of 5 | |
Compare This School To Nearby Schools ->
School Community Forum

Join a discussion about Patterson High School and talk to others in the community including students, parents, teachers, and administrators.
Popular Discussion Topics
- Admissions and Registration Questions (e.g. Dress Code and Discipline Policy)
- School Calendar and Upcoming Events (e.g. Graduation)
- After School Programs, Extracurricular Activities, and Athletics (e.g. Football)
- News and Announcements (e.g. Yearbook and Class Supply List Details)
- Graduate and Alumni Events (e.g. Organizing Class Reunions)
Navigation
Can't Find What You Are Looking For?
Rankings
Nearby Cities
Sponsored Links
K-12 Articles

National Memories
Few events are seared into our memory, and bring the country together-not as Democrat and...
Few events are seared into our memory, and bring the country together-not as Democrat and...

Hurt: A Book Report
My last book report was over 15 years ago, and I’m a bit rusty, but here goes (Don’t forget: book...
My last book report was over 15 years ago, and I’m a bit rusty, but here goes (Don’t forget: book...

Adolescents, Sleep and Learning
Recently, adolescent’s sleep habits have been in the news. Research has shown that adolescents need...
Recently, adolescent’s sleep habits have been in the news. Research has shown that adolescents need...