Yolo Junior High School
Rating
Not Available
Not Available

4 out of 5 | 1 Review
Find Old Friends From Yolo Junior High School
Use the form below to search for alumni from Yolo Junior High School.
School Description
School Summary and Highlights
- Enrolls 622 middle and high school students from grades 6-8
- Ranks 1420th out of 2,050 middle schools in CA.
- 2010 Overall School AYP Met Status: No
Additional Contact Information
- Mailing Address: 901 Hoyer Rd., Newman, CA 95360
School Operational Details
- Title I EligibleAll students of this school are eligible for participation in authorized programs.
School District Details
- Newman-Crows Landing Unified School District
- Per-Pupil Spending: $8,567
- Graduation Rate: 81.5%
- Dropout Rate: 2.9%
- Students Per Teacher: 22.7
- Enrolled Students: 2,725
Faculty Details and Student Enrollment
Students and Faculty
- Total Students Enrolled: 622
- Total Full Time "Equivalent" Teachers: 29.3
- Average Student-To-Teacher Ratio: 21.2
Students Gender Breakdown
- Males: 321 (51.6%)
- Females: 301 (48.4%)
Free Lunch Student Eligibility Breakdown
- Eligible for Reduced Lunch: 65 (10.5%)
- Eligible for Free Lunch: 372 (59.8%)
- Eligible for Either Reduced or Free Lunch: 437 (70.3%)
Student Enrollment Distribution by Race / Ethnicity
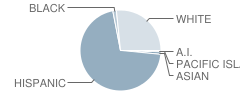
| Number | Percent | |
|---|---|---|
| American Indian | 3 | 0.5% |
| Black | 9 | 1.4% |
| Asian | 6 | 1.0% |
| Hispanic | 428 | 68.8% |
| White | 162 | 26.0% |
Number of Students Per Grade

| Number | Percent | |
|---|---|---|
| 6th Grade | 208 | 33.4% |
| 7th Grade | 215 | 34.6% |
| 8th Grade | 199 | 32.0% |
Teacher Education Background (2009)
Percent With Master's Degree
School:
6.7%
District:
40.0%
Percent With Bachelor's Degree: 6.7%
Teacher Credentials & Experience (2009)
Percent of Teachers With Emergency Credentials: 3.6%
Percent of Teachers With Credentials: 100.0%
Number of Certificated Staff: 30.0
Average Number of Years of Teacher Experience: 11.4
Average Age
School:
42.7
District:
41.8
Source: CA Department of Education, Source: NCES 2009-2010
School Ratings and Reviews
Overall Rating: 4

4 out of 5 | 1 Review
The Overall Rating is the school's average rating from parents, students, school faculty and staff. The highest rating is five apples and the lowest is one apple.
Share Your Review About This School
1 review for Yolo Junior High School
- Reviewed by Student on November 18, 2006
- Rating:
 (4 / 5) Flag as inappropriate
 - why i give yolo a B-.this school is a good one and teachers are 'satisfactory'.now to 'discrible' the 'students' there ok.every ones in a group.you have the prep[populars]who think there geeks,the nerds,the average people[people who arent exactly popolular],and the misfits[the average kind of people who just dont have a lot of friends.]so dont enter your child unless they already have friends.that is why i give this school a B-.
School Map and Similar Schools Nearby
Click to Activate Map of Nearby School Campuses
Private
Public
This School
Similar Schools Nearby
| Orestimba High School 9-12 | 738 Students | 0.6 miles away | Not Yet Rated | |
| Gustine High School 9-12 | 528 Students | 4.1 miles away |  5 out of 5 | |
| Hilmar High School 9-12 | 699 Students | 11.9 miles away | 5 out of 5 | |
| Patterson High School 9-12 | 1,608 Students | 12.3 miles away |  3 out of 5 | |
| Delhi High School 9-12 | 682 Students | 15.4 miles away | Not Yet Rated | |
| John H. Pitman High School 9-12 | 2,207 Students | 17.3 miles away | Not Yet Rated | |
| Turlock High School 9-12 | 2,250 Students | 17.3 miles away | 5 out of 5 | |
| Turlock Junior High School 7-8 | 1,315 Students | 17.4 miles away | Not Yet Rated | |
| Livingston High School 9-12 | 1,198 Students | 17.7 miles away | 5 out of 5 | |
| Central Valley High School 9-12 | 1,654 Students | 18.9 miles away | Not Yet Rated | |
Compare This School To Nearby Schools ->
School Community Forum

Join a discussion about Yolo Junior High School and talk to others in the community including students, parents, teachers, and administrators.
Popular Discussion Topics
- Admissions and Registration Questions (e.g. Dress Code and Discipline Policy)
- School Calendar and Upcoming Events (e.g. Graduation)
- After School Programs, Extracurricular Activities, and Athletics (e.g. Football)
- News and Announcements (e.g. Yearbook and Class Supply List Details)
- Graduate and Alumni Events (e.g. Organizing Class Reunions)
Navigation
Can't Find What You Are Looking For?
Rankings
Nearby Cities
Sponsored Links
K-12 Articles

Parent-Teacher Conference Dos and Don'ts
Finals are over and done, and grades have arrived. Now comes the dreaded time to discuss the...
Finals are over and done, and grades have arrived. Now comes the dreaded time to discuss the...

Teaching Your Kids About Respect, Values and Violence
These days it seems that every newscast reports at least once incident of violence. As parents, we...
These days it seems that every newscast reports at least once incident of violence. As parents, we...

Is Your Child Happy at School?
As a parent, you’d love to have your child share all of his feelings with you. It would be so easy...
As a parent, you’d love to have your child share all of his feelings with you. It would be so easy...