Orestimba High School
Rating
Not Available
Not Available

No Reviews Yet
Find Old Friends From Orestimba High School
Use the form below to search for alumni from Orestimba High School.
School Description
School Summary and Highlights
- Enrolls 738 high school students from grades 9-12
- Ranks 578th out of 1,197 high schools in CA.
- 2010 Overall School AYP Met Status: No
Additional Contact Information
- Mailing Address: 707 Hardin Rd., Newman, CA 95360
School Operational Details
- Title I EligibleAll students of this school are eligible for participation in authorized programs.
School District Details
- Newman-Crows Landing Unified School District
- Per-Pupil Spending: $8,567
- Graduation Rate: 81.5%
- Dropout Rate: 2.9%
- Students Per Teacher: 22.7
- Enrolled Students: 2,725
Faculty Details and Student Enrollment
Students and Faculty
- Total Students Enrolled: 738
- Total Full Time "Equivalent" Teachers: 35.0
- Average Student-To-Teacher Ratio: 21.1
Students Gender Breakdown
- Males: 375 (50.8%)
- Females: 363 (49.2%)
Free Lunch Student Eligibility Breakdown
- Eligible for Reduced Lunch: 103 (14.0%)
- Eligible for Free Lunch: 347 (47.0%)
- Eligible for Either Reduced or Free Lunch: 450 (61.0%)
Student Enrollment Distribution by Race / Ethnicity
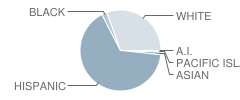
| Number | Percent | |
|---|---|---|
| American Indian | 2 | 0.3% |
| Black | 16 | 2.2% |
| Asian | 8 | 1.1% |
| Hispanic | 476 | 64.5% |
| White | 221 | 29.9% |
Number of Students Per Grade
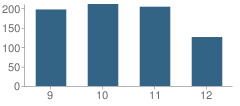
| Number | Percent | |
|---|---|---|
| 9th Grade | 197 | 26.7% |
| 10th Grade | 211 | 28.6% |
| 11th Grade | 204 | 27.6% |
| 12th Grade | 126 | 17.1% |
Graduates Information (2010)
Graduation Rate
School:
93.1%
District:
86.1%
State:
78.6%
Teacher Education Background (2009)
Percent With Bachelor's Degree: 16.2%
Percent With Master's Degree
School:
8.1%
District:
40.0%
Teacher Credentials & Experience (2009)
Average Age
School:
38.9
District:
41.8
Average Number of Years of Teacher Experience: 9.9
Number of Certificated Staff: 37.0
Percent of Teachers With Credentials: 97.1%
Source: CA Department of Education, Source: NCES 2009-2010
School Ratings and Reviews
Be The First To Review Orestimba High School!
School Map and Similar Schools Nearby
Click to Activate Map of Nearby School Campuses
Private
Public
This School
Similar Schools Nearby
| Yolo Junior High School 6-8 | 622 Students | 0.6 miles away |  4 out of 5 | |
| Gustine High School 9-12 | 528 Students | 4.6 miles away |  5 out of 5 | |
| Hilmar High School 9-12 | 699 Students | 11.4 miles away | 5 out of 5 | |
| Patterson High School 9-12 | 1,608 Students | 11.9 miles away |  3 out of 5 | |
| Delhi High School 9-12 | 682 Students | 14.9 miles away | Not Yet Rated | |
| John H. Pitman High School 9-12 | 2,207 Students | 16.6 miles away | Not Yet Rated | |
| Turlock High School 9-12 | 2,250 Students | 16.7 miles away | 5 out of 5 | |
| Turlock Junior High School 7-8 | 1,315 Students | 16.8 miles away | Not Yet Rated | |
| Livingston High School 9-12 | 1,198 Students | 17.3 miles away | 5 out of 5 | |
| Central Valley High School 9-12 | 1,654 Students | 18.3 miles away | Not Yet Rated | |
Compare This School To Nearby Schools ->
School Community Forum

Join a discussion about Orestimba High School and talk to others in the community including students, parents, teachers, and administrators.
Popular Discussion Topics
- Admissions and Registration Questions (e.g. Dress Code and Discipline Policy)
- School Calendar and Upcoming Events (e.g. Graduation)
- After School Programs, Extracurricular Activities, and Athletics (e.g. Football)
- News and Announcements (e.g. Yearbook and Class Supply List Details)
- Graduate and Alumni Events (e.g. Organizing Class Reunions)
Navigation
Can't Find What You Are Looking For?
Rankings
Nearby Cities
Sponsored Links
K-12 Articles

Cell Phones... the Best Thing Since Sliced Bread or the Worst Invention in the World?
Cell phones are wonderful, the best things humans have ever invented! They help us keep in touch...
Cell phones are wonderful, the best things humans have ever invented! They help us keep in touch...

Is Your Child's Teacher a Bully?
We’ve all heard about kids being bullied by peers. Kids taunt, tease, pull hair, shove and push...
We’ve all heard about kids being bullied by peers. Kids taunt, tease, pull hair, shove and push...

The Most Used Form of Communication
Writing has, quite surprisingly, become more and more important in today’s electronic society....
Writing has, quite surprisingly, become more and more important in today’s electronic society....