Scripps Ranch High School

No Reviews Yet
Find Old Friends From Scripps Ranch High School
Use the form below to search for alumni from Scripps Ranch High School.
School Description
School Summary and Highlights
- Enrolls 2,390 high school students from grades 9-12
- Ranks 146th out of 1,197 high schools in CA.
- 2010 Overall School AYP Met Status: Yes
Additional Contact Information
- Mailing Address: 10410 Treena St., San Diego, CA 92131
School District Details
- San Diego Unified School District
- Per-Pupil Spending: $10,305
- Graduation Rate: 63.0%
- Dropout Rate: 2.4%
- Students Per Teacher: 20.1
- Enrolled Students: 131,163
Faculty Details and Student Enrollment
Students and Faculty
- Total Students Enrolled: 2,390
- Total Full Time "Equivalent" Teachers: 79.6
- Average Student-To-Teacher Ratio: 30.0
Students Gender Breakdown
- Males: 1,178 (49.3%)
- Females: 1,212 (50.7%)
Free Lunch Student Eligibility Breakdown
- Eligible for Reduced Lunch: 6 (0.3%)
- Eligible for Free Lunch: 588 (24.6%)
- Eligible for Either Reduced or Free Lunch: 594 (24.9%)
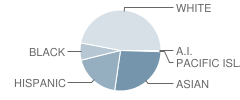
Student Enrollment Distribution by Race / Ethnicity

| Number | Percent | |
|---|---|---|
| American Indian | 6 | 0.3% |
| Black | 162 | 6.8% |
| Asian | 628 | 26.3% |
| Hispanic | 442 | 18.5% |
| White | 1,099 | 46.0% |
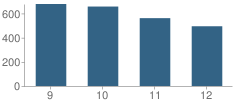
Number of Students Per Grade

| Number | Percent | |
|---|---|---|
| 9th Grade | 678 | 28.4% |
| 10th Grade | 657 | 27.5% |
| 11th Grade | 561 | 23.5% |
| 12th Grade | 494 | 20.7% |
Graduates Information (2010)
Graduation Rate
School:
90.3%
District:
79.3%
State:
78.6%
Teacher Education Background (2009)
Percent With Master's Degree
School:
66.7%
District:
80.1%
Percent With Bachelor's Degree
School:
30.6%
District:
16.8%
Teacher Credentials & Experience (2009)
Percent of Teachers With Credentials: 100.0%
Number of Certificated Staff: 108.0
Average Number of Years of Teacher Experience: 17.9
Average Age
School:
45.4
District:
46.6
Source: CA Department of Education, Source: NCES 2009-2010
School Ratings and Reviews
Be The First To Review Scripps Ranch High School!
Sponsored Links
Test Scores and Performance Information
Overall School Rating
How is this determined?
The overall school rating shows that Scripps Ranch High School performed on average better than many other schools across the state on CST state exams in the following subjects:
- CST Algebra I
- CST Algebra II
- CST Biology
- CST Chemistry
- CST English-Language Arts
- CST Geometry
- CST Integrated Math 1
- CST Physics
- CST Science
- CST Summative High School Math
- CST U.S. History
- CST World History
AYP Results (2010)
Overall AYP Met: Yes
ELA AYP Met: Yes
Math AYP Met: Yes
ACT Exam Results (2009)
Percent of Students Taking ACT Exam: 26.4%
Average Combined Score: 24.8
Percent Scoring At or Above 21: 81.9%
SAT Exam Results (2009)
Percent of Students Taking SAT Exam: 71.7%
Average Combined Score: 1,693.8
Critical Reading Average: 561.3
Math Average: 579.5
Writing Average: 553.0
Percent Scoring At or Above 1500: 71.6%
CST - Test Proficiency by Grade and Subject
Grade 9 - % of students at or above proficiency
| School | District | State | |
|---|---|---|---|
| CST Algebra I Test | |||
| 2010 | 26.0% | 15.0% | 22.0% |
| 2009 | 30.0% | 13.0% | 21.0% |
| 2008 | 7.0% | 8.0% | 18.0% |
| CST Algebra II Test | |||
| 2010 | 100.0% | 59.0% | 69.0% |
| 2009 | 88.0% | 49.0% | 65.0% |
| 2008 | 88.0% | 50.0% | 66.0% |
| CST English-Language Arts Test | |||
| 2010 | 80.0% | 58.0% | 54.0% |
| 2009 | 79.0% | 52.0% | 50.0% |
| 2008 | 76.0% | 50.0% | 49.0% |
| CST Geometry Test | |||
| 2010 | 63.0% | 29.0% | 46.0% |
| 2009 | 65.0% | 28.0% | 47.0% |
| 2008 | 58.0% | 26.0% | 43.0% |
| CST Physics Test | |||
| 2010 | 56.0% | 49.0% | 40.0% |
| 2009 | 49.0% | 36.0% | 35.0% |
| 2008 | 43.0% | 31.0% | 30.0% |
| CST World History Test | |||
| 2010 | 84.0% | 57.0% | 45.0% |
| 2009 | 82.0% | 59.0% | 41.0% |
| 2008 | 83.0% | 57.0% | 36.0% |
Grade 10 - % of students at or above proficiency
| School | District | State | |
|---|---|---|---|
| CST Algebra II Test | |||
| 2010 | 59.0% | 25.0% | 40.0% |
| 2009 | 49.0% | 22.0% | 37.0% |
| 2008 | 43.0% | 20.0% | 36.0% |
| CST Biology Test | |||
| 2010 | 34.0% | 37.0% | 38.0% |
| 2009 | - | - | - |
| 2008 | 15.0% | 31.0% | 35.0% |
| CST Chemistry Test | |||
| 2010 | 65.0% | 48.0% | 47.0% |
| 2009 | 49.0% | 36.0% | 44.0% |
| 2008 | 46.0% | 31.0% | 41.0% |
| CST English-Language Arts Test | |||
| 2010 | 78.0% | 48.0% | 45.0% |
| 2009 | 74.0% | 44.0% | 44.0% |
| 2008 | 68.0% | 40.0% | 41.0% |
| CST Geometry Test | |||
| 2010 | 15.0% | 7.0% | 14.0% |
| 2009 | 14.0% | 7.0% | 14.0% |
| 2008 | 8.0% | 5.0% | 12.0% |
| CST Integrated Math 1 Test | |||
| 2010 | 46.0% | 16.0% | 11.0% |
| 2009 | 48.0% | 16.0% | 9.0% |
| 2008 | 68.0% | 17.0% | 10.0% |
| CST Physics Test | |||
| 2010 | 69.0% | 35.0% | 44.0% |
| 2009 | 46.0% | 23.0% | 40.0% |
| 2008 | 23.0% | 24.0% | 36.0% |
| CST Science Test | |||
| 2010 | 53.0% | 44.0% | 46.0% |
| 2009 | 43.0% | 40.0% | 44.0% |
| 2008 | 35.0% | 32.0% | 40.0% |
| CST Summative High School Math Test | |||
| 2010 | 98.0% | 61.0% | 75.0% |
| 2009 | 96.0% | 63.0% | 71.0% |
| 2008 | 83.0% | 60.0% | 68.0% |
| CST World History Test | |||
| 2010 | 67.0% | 39.0% | 42.0% |
| 2009 | 53.0% | 35.0% | 38.0% |
| 2008 | 48.0% | 29.0% | 33.0% |
| CST Algebra I Test | |||
| 2009 | 4.0% | 9.0% | 11.0% |
| 2008 | 5.0% | 5.0% | 9.0% |
Grade 11 - % of students at or above proficiency
| School | District | State | |
|---|---|---|---|
| CST Algebra II Test | |||
| 2010 | 21.0% | 6.0% | 14.0% |
| 2009 | 7.0% | 4.0% | 12.0% |
| 2008 | 6.0% | 3.0% | 11.0% |
| CST Biology Test | |||
| 2010 | 86.0% | 58.0% | 46.0% |
| 2009 | 76.0% | 50.0% | 41.0% |
| 2008 | 66.0% | 43.0% | 39.0% |
| CST Chemistry Test | |||
| 2010 | 33.0% | 20.0% | 30.0% |
| 2009 | 29.0% | 14.0% | 27.0% |
| 2008 | 40.0% | 15.0% | 25.0% |
| CST English-Language Arts Test | |||
| 2010 | 72.0% | 45.0% | 42.0% |
| 2009 | 67.0% | 41.0% | 40.0% |
| 2008 | 63.0% | 38.0% | 37.0% |
| CST Geometry Test | |||
| 2010 | 7.0% | 4.0% | 6.0% |
| 2009 | 10.0% | 2.0% | 7.0% |
| 2008 | 9.0% | 2.0% | 6.0% |
| CST Integrated Math 1 Test | |||
| 2010 | 42.0% | 9.0% | 11.0% |
| 2009 | 27.0% | 9.0% | 9.0% |
| 2008 | 31.0% | 5.0% | 9.0% |
| CST Physics Test | |||
| 2010 | 58.0% | 26.0% | 53.0% |
| 2009 | 59.0% | 31.0% | 50.0% |
| 2008 | 23.0% | 30.0% | 47.0% |
| CST Summative High School Math Test | |||
| 2010 | 57.0% | 35.0% | 50.0% |
| 2009 | 54.0% | 32.0% | 47.0% |
| 2008 | 52.0% | 30.0% | 43.0% |
| CST U.S. History Test | |||
| 2010 | 75.0% | 47.0% | 45.0% |
| 2009 | 70.0% | 44.0% | 44.0% |
| 2008 | 64.0% | 36.0% | 38.0% |
End of Course - % of students at or above proficiency
| School | District | State | |
|---|---|---|---|
| CST Algebra I Test | |||
| 2010 | 26.0% | 34.0% | 31.0% |
| 2009 | 27.0% | 30.0% | 28.0% |
| 2008 | 6.0% | 25.0% | 25.0% |
| CST Algebra II Test | |||
| 2010 | 55.0% | 22.0% | 31.0% |
| 2009 | 45.0% | 19.0% | 28.0% |
| 2008 | 41.0% | 17.0% | 27.0% |
| CST Biology Test | |||
| 2010 | 79.0% | 44.0% | 46.0% |
| 2009 | 74.0% | 40.0% | 42.0% |
| 2008 | 64.0% | 38.0% | 42.0% |
| CST Chemistry Test | |||
| 2010 | 63.0% | 29.0% | 38.0% |
| 2009 | 48.0% | 23.0% | 36.0% |
| 2008 | 45.0% | 26.0% | 32.0% |
| CST Geometry Test | |||
| 2010 | 46.0% | 22.0% | 27.0% |
| 2009 | 50.0% | 21.0% | 26.0% |
| 2008 | 42.0% | 17.0% | 24.0% |
| CST Integrated Math 1 Test | |||
| 2010 | 43.0% | 10.0% | 13.0% |
| 2009 | 33.0% | 11.0% | 11.0% |
| 2008 | 42.0% | 9.0% | 11.0% |
| CST Physics Test | |||
| 2010 | 56.0% | 44.0% | 49.0% |
| 2009 | 49.0% | 34.0% | 46.0% |
| 2008 | 42.0% | 31.0% | 43.0% |
| CST Summative High School Math Test | |||
| 2010 | 62.0% | 39.0% | 54.0% |
| 2009 | 59.0% | 37.0% | 50.0% |
| 2008 | 56.0% | 34.0% | 47.0% |
| CST World History Test | |||
| 2010 | 74.0% | 41.0% | 41.0% |
| 2009 | 67.0% | 38.0% | 38.0% |
| 2008 | 63.0% | 31.0% | 33.0% |
Source: CA Department of Education 2009-2010
School Map and Similar Schools Nearby
Click to Activate Map of Nearby School Campuses
Private
Public
This School
Similar Schools Nearby
| Mira Mesa High School 9-12 | 2,637 Students | 1.6 miles away | Not Yet Rated | |
| Mt. Carmel High School 9-12 | 2,205 Students | 4.1 miles away | Not Yet Rated | |
| Westview High School 9-12 | 2,366 Students | 4.4 miles away | Not Yet Rated | |
| Canyon Crest Academy 9-12 | 1,811 Students | 5.6 miles away | Not Yet Rated | |
| Serra High School 9-12 | 2,087 Students | 5.8 miles away | Not Yet Rated | |
| Madison High School 9-12 | 1,246 Students | 6.4 miles away | ![]() 3 out of 5 | |
| University City High School 9-12 | 1,852 Students | 6.5 miles away | ![]() 4 out of 5 | |
| Rancho Bernardo High School 9-12 | 2,570 Students | 6.5 miles away | Not Yet Rated | |
| West Hills High School 9-12 | 2,161 Students | 7.1 miles away | ![]() 5 out of 5 | |
| Torrey Pines High School 9-12 | 2,629 Students | 7.3 miles away | Not Yet Rated | |
Compare This School To Nearby Schools ->
School Community Forum

Join a discussion about Scripps Ranch High School and talk to others in the community including students, parents, teachers, and administrators.
Popular Discussion Topics
- Admissions and Registration Questions (e.g. Dress Code and Discipline Policy)
- School Calendar and Upcoming Events (e.g. Graduation)
- After School Programs, Extracurricular Activities, and Athletics (e.g. Football)
- News and Announcements (e.g. Yearbook and Class Supply List Details)
- Graduate and Alumni Events (e.g. Organizing Class Reunions)
Navigation
Can't Find What You Are Looking For?
Rankings
Nearby Cities
Sponsored Links
K-12 Articles
What to Do when Your Student is Held Back
Kids develop at different speeds, and everyone has different skills and abilities. School is easy...
Teaching Children a Love of History
Parents and grandparents are responsible for teaching children a love of history. To begin, relate...
How to Get the Best Supplies for Your Money
School supply lists can seem unending, and the price can add up very quickly. But do we really...


