Farb Middle School
Rating
Not Available
Not Available

No Reviews Yet
Find Old Friends From Farb Middle School
Use the form below to search for alumni from Farb Middle School.
School Description
School Summary and Highlights
- Enrolls 728 middle school students from grades 6-8
- Ranks 1353rd out of 2,050 middle schools in CA.
- 2010 Overall School AYP Met Status: No
Additional Contact Information
- Mailing Address: 4880 La Cuenta Dr., San Diego, CA 92124
School Operational Details
- Title I EligibleAll students of this school are eligible for participation in authorized programs.
School District Details
- San Diego Unified School District
- Per-Pupil Spending: $10,305
- Graduation Rate: 63.0%
- Dropout Rate: 2.4%
- Students Per Teacher: 20.1
- Enrolled Students: 131,163
Faculty Details and Student Enrollment
Students and Faculty
- Total Students Enrolled: 728
- Total Full Time "Equivalent" Teachers: 32.9
- Average Student-To-Teacher Ratio: 22.1
Students Gender Breakdown
- Males: 390 (53.6%)
- Females: 338 (46.4%)
Free Lunch Student Eligibility Breakdown
- Eligible for Reduced Lunch: 151 (20.7%)
- Eligible for Free Lunch: 439 (60.3%)
- Eligible for Either Reduced or Free Lunch: 590 (81.0%)
Student Enrollment Distribution by Race / Ethnicity
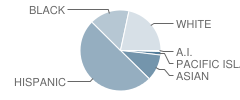
| Number | Percent | |
|---|---|---|
| American Indian | 4 | 0.5% |
| Black | 112 | 15.4% |
| Asian | 75 | 10.3% |
| Hispanic | 350 | 48.1% |
| White | 152 | 20.9% |
Number of Students Per Grade

| Number | Percent | |
|---|---|---|
| 6th Grade | 223 | 30.6% |
| 7th Grade | 258 | 35.4% |
| 8th Grade | 247 | 33.9% |
Teacher Education Background (2009)
Percent With Master's Degree
School:
69.8%
District:
80.1%
Percent With Bachelor's Degree
School:
27.9%
District:
16.8%
Teacher Credentials & Experience (2009)
Percent of Teachers With Emergency Credentials: 2.7%
Percent of Teachers With Credentials: 100.0%
Number of Certificated Staff: 43.0
Average Number of Years of Teacher Experience: 12.9
Average Age
School:
42.6
District:
46.6
Source: CA Department of Education, Source: NCES 2009-2010
School Ratings and Reviews
Be The First To Review Farb Middle School!
School Map and Similar Schools Nearby
Click to Activate Map of Nearby School Campuses
Private
Public
This School
Similar Schools Nearby
| De Portola (Gasper) Middle School 6-8 | 1,020 Students | 0.7 miles away | Not Yet Rated | |
| Lewis Middle School 6-8 | 1,096 Students | 1.9 miles away |  5 out of 5 | |
| Taft Middle School 6-8 | 606 Students | 2.2 miles away | Not Yet Rated | |
| Lindbergh / Schweitzer Elementary School KG-6 | 610 Students | 4.0 miles away | Not Yet Rated | |
| Lafayette Elementary School KG-6 | 316 Students | 4.0 miles away | Not Yet Rated | |
| Language Academy KG-8 | 865 Students | 4.1 miles away | Not Yet Rated | |
| Innovation Middle School 7-8 | 510 Students | 4.5 miles away | Not Yet Rated | - |
| Mann School of Expedition 6-8 | 849 Students | 4.6 miles away | Not Yet Rated | |
| Wilson Middle School 6-8 | 622 Students | 4.6 miles away | Not Yet Rated | |
| Sequoia Elementary School KG-6 | 251 Students | 4.7 miles away | Not Yet Rated | |
Compare This School To Nearby Schools ->
School Community Forum

Join a discussion about Farb Middle School and talk to others in the community including students, parents, teachers, and administrators.
Popular Discussion Topics
- Admissions and Registration Questions (e.g. Dress Code and Discipline Policy)
- School Calendar and Upcoming Events (e.g. Graduation)
- After School Programs, Extracurricular Activities, and Athletics (e.g. Football)
- News and Announcements (e.g. Yearbook and Class Supply List Details)
- Graduate and Alumni Events (e.g. Organizing Class Reunions)
Navigation
Can't Find What You Are Looking For?
Rankings
Nearby Cities
Sponsored Links
K-12 Articles

Keeping Our Kids Safe in the Post 9/11 World
Recently, radio talk show host and CNN personality did a week-long special entitled “The Perfect...
Recently, radio talk show host and CNN personality did a week-long special entitled “The Perfect...

Teaching Your Kids About Respect, Values and Violence
These days it seems that every newscast reports at least once incident of violence. As parents, we...
These days it seems that every newscast reports at least once incident of violence. As parents, we...

Everyone Loves Going to the Doctor and Dentist
Going to the doctor or dentist can be traumatic for children of all ages. Many adults do not...
Going to the doctor or dentist can be traumatic for children of all ages. Many adults do not...