Standley Middle School
Rating
Not Available
Not Available

No Reviews Yet
Find Old Friends From Standley Middle School
Use the form below to search for alumni from Standley Middle School.
School Description
School Summary and Highlights
- Enrolls 1,256 middle school students from grades 6-8
- Ranks 385th out of 2,050 middle schools in CA.
- 2010 Overall School AYP Met Status: No
Additional Contact Information
- Mailing Address: 6298 Radcliffe Dr., San Diego, CA 92122
School Operational Details
- Title I EligibleAll students of this school are eligible for participation in authorized programs.
School District Details
- San Diego Unified School District
- Per-Pupil Spending: $10,305
- Graduation Rate: 63.0%
- Dropout Rate: 2.4%
- Students Per Teacher: 20.1
- Enrolled Students: 131,163
Faculty Details and Student Enrollment
Students and Faculty
- Total Students Enrolled: 1,256
- Total Full Time "Equivalent" Teachers: 52.6
- Average Student-To-Teacher Ratio: 23.9
Students Gender Breakdown
- Males: 637 (50.7%)
- Females: 619 (49.3%)
Free Lunch Student Eligibility Breakdown
- Eligible for Reduced Lunch: 81 (6.4%)
- Eligible for Free Lunch: 484 (38.5%)
- Eligible for Either Reduced or Free Lunch: 565 (45.0%)
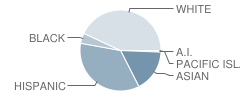
Student Enrollment Distribution by Race / Ethnicity
| Number | Percent | |
|---|---|---|
| American Indian | 6 | 0.5% |
| Black | 50 | 4.0% |
| Asian | 202 | 16.1% |
| Hispanic | 422 | 33.6% |
| White | 514 | 40.9% |
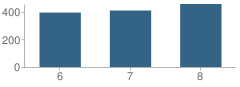
Number of Students Per Grade
| Number | Percent | |
|---|---|---|
| 6th Grade | 393 | 31.3% |
| 7th Grade | 408 | 32.5% |
| 8th Grade | 455 | 36.2% |
Teacher Education Background (2009)
Percent With Master's Degree
School:
66.1%
District:
80.1%
Percent With Bachelor's Degree
School:
33.9%
District:
16.8%
Teacher Credentials & Experience (2009)
Percent of Teachers With Credentials: 98.2%
Number of Certificated Staff: 62.0
Average Number of Years of Teacher Experience: 15.1
Average Age
School:
43.9
District:
46.6
Source: CA Department of Education, Source: NCES 2009-2010
School Ratings and Reviews
Be The First To Review Standley Middle School!
School Map and Similar Schools Nearby
Click to Activate Map of Nearby School Campuses
Private
Public
This School
Similar Schools Nearby
| Whitman Elementary School KG-6 | 336 Students | 1.1 miles away | Not Yet Rated | |
| Hawthorne Elementary School KG-6 | 325 Students | 1.3 miles away | Not Yet Rated | |
| Field Elementary School KG-6 | 294 Students | 1.5 miles away | Not Yet Rated | |
| Creative, Performing, and Media Arts School 6-8 | 986 Students | 1.7 miles away | Not Yet Rated | |
| Innovation Middle School 7-8 | 510 Students | 2.1 miles away | Not Yet Rated | - |
| John Muir School KG-12 | 380 Students | 2.1 miles away | Not Yet Rated | |
| Sequoia Elementary School KG-6 | 251 Students | 2.3 miles away | Not Yet Rated | |
| Lafayette Elementary School KG-6 | 316 Students | 2.8 miles away | Not Yet Rated | |
| Holmes Elementary School KG-6 | 492 Students | 3.0 miles away | Not Yet Rated | |
| Marston Middle School 6-8 | 891 Students | 3.1 miles away | Not Yet Rated | |
Compare This School To Nearby Schools ->
School Community Forum

Join a discussion about Standley Middle School and talk to others in the community including students, parents, teachers, and administrators.
Popular Discussion Topics
- Admissions and Registration Questions (e.g. Dress Code and Discipline Policy)
- School Calendar and Upcoming Events (e.g. Graduation)
- After School Programs, Extracurricular Activities, and Athletics (e.g. Football)
- News and Announcements (e.g. Yearbook and Class Supply List Details)
- Graduate and Alumni Events (e.g. Organizing Class Reunions)
Navigation
Can't Find What You Are Looking For?
Rankings
Nearby Cities
Sponsored Links
K-12 Articles

Teaching Children Respect
Statistics prove that there are many different family types in today’s society. Grandparents or a...
Statistics prove that there are many different family types in today’s society. Grandparents or a...

Imho
I was watching Headline News’s news ticker when I read something that made me LOL. The ticker said...
I was watching Headline News’s news ticker when I read something that made me LOL. The ticker said...

Is Your Child Happy at School?
As a parent, you’d love to have your child share all of his feelings with you. It would be so easy...
As a parent, you’d love to have your child share all of his feelings with you. It would be so easy...