Arizona Virtual Academy

No Reviews Yet
Find Old Friends From Arizona Virtual Academy
Use the form below to search for alumni from Arizona Virtual Academy.
School Description
School Summary and Highlights
- Enrolls 4,276 elementary, middle, and high school students from grades KG-12
- Ranks 116th out of 385 high schools in AZ.
Additional Contact Information
- Mailing Address: 99 E. Virginia Ave., Phoenix, AZ 85004
School Operational Details
- Title I Eligible
- Charter School
School District Details
- Ppep & Affiliates, Inc. Dba Arizona Virtual Academy
- Per-Pupil Spending: $6,746
- Enrolled Students: 4,276
Faculty Details and Student Enrollment
Students and Faculty
- Total Students Enrolled: 4,276
- Total Full Time "Equivalent" Teachers: 0
Students Gender Breakdown
- Males: 2,213 (51.8%)
- Females: 2,063 (48.2%)
Free Lunch Student Eligibility Breakdown
- Eligible for Reduced Lunch: 804 (18.8%)
- Eligible for Free Lunch: 1,459 (34.1%)
- Eligible for Either Reduced or Free Lunch: 2,263 (52.9%)
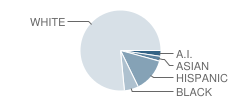
Student Enrollment Distribution by Race / Ethnicity

| Number | Percent | |
|---|---|---|
| American Indian | 99 | 2.3% |
| Black | 243 | 5.7% |
| Asian | 83 | 1.9% |
| Hispanic | 578 | 13.5% |
| White | 3,273 | 76.5% |
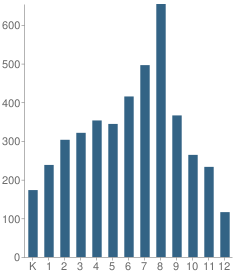
Number of Students Per Grade

| Number | Percent | |
|---|---|---|
| Kindergarten | 173 | 4.0% |
| 1st Grade | 238 | 5.6% |
| 2nd Grade | 303 | 7.1% |
| 3rd Grade | 321 | 7.5% |
| 4th Grade | 353 | 8.3% |
| 5th Grade | 344 | 8.0% |
| 6th Grade | 415 | 9.7% |
| 7th Grade | 496 | 11.6% |
| 8th Grade | 654 | 15.3% |
| 9th Grade | 366 | 8.6% |
| 10th Grade | 264 | 6.2% |
| 11th Grade | 233 | 5.4% |
| 12th Grade | 116 | 2.7% |
Source: AZ Department of Education, Source: NCES 2009-2010
School Ratings and Reviews
Be The First To Review Arizona Virtual Academy!
Sponsored Links
Test Scores and Performance Information
Overall School Rating
How is this determined?
The overall school rating shows that Arizona Virtual Academy performed on average about the same as other schools across the state on AIMS state exams in the following subjects:
- Math
- Reading
- Science
- Writing
AIMS - Test Proficiency by Grade and Subject
Grade 3 - % of students at or above proficiency
| School | District | State | |
|---|---|---|---|
| Math Test | |||
| 2010 | 46.0% | 46.0% | 65.0% |
| 2009 | 71.0% | 71.0% | - |
| 2008 | 58.0% | 58.0% | 71.0% |
| Reading Test | |||
| 2010 | 66.0% | 66.0% | 73.0% |
| 2009 | 67.0% | 67.0% | - |
| 2008 | 79.0% | 79.0% | 69.0% |
| Writing Test | |||
| 2009 | 47.0% | 47.0% | - |
| 2008 | 51.0% | 51.0% | 76.0% |
Grade 4 - % of students at or above proficiency
| School | District | State | |
|---|---|---|---|
| Math Test | |||
| 2010 | 50.0% | 50.0% | 63.0% |
| 2009 | 64.0% | 64.0% | - |
| 2008 | 72.0% | 72.0% | 74.0% |
| Reading Test | |||
| 2010 | 69.0% | 69.0% | 71.0% |
| 2009 | 85.0% | 85.0% | - |
| 2008 | 83.0% | 83.0% | 69.0% |
| Science Test | |||
| 2010 | 61.0% | 61.0% | 61.0% |
| 2009 | 63.0% | 63.0% | - |
| 2008 | 56.0% | 56.0% | 53.0% |
| Writing Test | |||
| 2009 | 62.0% | 62.0% | - |
| 2008 | 48.0% | 48.0% | 70.0% |
Grade 5 - % of students at or above proficiency
| School | District | State | |
|---|---|---|---|
| Math Test | |||
| 2010 | 47.0% | 47.0% | 58.0% |
| 2009 | 57.0% | 57.0% | - |
| 2008 | 64.0% | 64.0% | 70.0% |
| Reading Test | |||
| 2010 | 75.0% | 75.0% | 72.0% |
| 2009 | 90.0% | 90.0% | - |
| 2008 | 74.0% | 74.0% | 68.0% |
| Writing Test | |||
| 2010 | 64.0% | 64.0% | 74.0% |
| 2009 | 58.0% | 58.0% | - |
| 2008 | 48.0% | 48.0% | 65.0% |
Grade 6 - % of students at or above proficiency
| School | District | State | |
|---|---|---|---|
| Math Test | |||
| 2010 | 37.0% | 37.0% | 56.0% |
| 2009 | 64.0% | 64.0% | - |
| 2008 | 71.0% | 71.0% | 67.0% |
| Reading Test | |||
| 2010 | 78.0% | 78.0% | 78.0% |
| 2009 | 72.0% | 72.0% | - |
| 2008 | 73.0% | 73.0% | 68.0% |
| Writing Test | |||
| 2010 | 63.0% | 63.0% | 73.0% |
| 2009 | 73.0% | 73.0% | - |
| 2008 | 57.0% | 57.0% | 72.0% |
Grade 7 - % of students at or above proficiency
| School | District | State | |
|---|---|---|---|
| Math Test | |||
| 2010 | 43.0% | 43.0% | 57.0% |
| 2009 | 61.0% | 61.0% | - |
| 2008 | 66.0% | 66.0% | 71.0% |
| Reading Test | |||
| 2010 | 77.0% | 77.0% | 77.0% |
| 2009 | 82.0% | 82.0% | - |
| 2008 | 76.0% | 76.0% | 70.0% |
| Writing Test | |||
| 2010 | 61.0% | 61.0% | 75.0% |
| 2009 | 65.0% | 65.0% | - |
| 2008 | 52.0% | 52.0% | 65.0% |
Grade 8 - % of students at or above proficiency
| School | District | State | |
|---|---|---|---|
| Math Test | |||
| 2010 | 38.0% | 38.0% | 57.0% |
| 2009 | 48.0% | 48.0% | - |
| 2008 | 47.0% | 47.0% | 62.0% |
| Reading Test | |||
| 2010 | 72.0% | 72.0% | 73.0% |
| 2009 | 70.0% | 70.0% | - |
| 2008 | 66.0% | 66.0% | 67.0% |
| Science Test | |||
| 2010 | 52.0% | 52.0% | 58.0% |
| 2009 | 44.0% | 44.0% | - |
| 2008 | 45.0% | 45.0% | 50.0% |
| Writing Test | |||
| 2009 | 71.0% | 71.0% | - |
| 2008 | 69.0% | 69.0% | 76.0% |
Grade 2011 Cohort - % of students at or above proficiency
| School | District | State | |
|---|---|---|---|
| Math Test | |||
| 2010 | 24.0% | 24.0% | 19.0% |
| 2009 | 63.0% | 63.0% | 87.0% |
| Reading Test | |||
| 2010 | 67.0% | 67.0% | 47.0% |
| 2009 | 85.0% | 85.0% | 83.0% |
| Writing Test | |||
| 2010 | 56.0% | 56.0% | 45.0% |
| 2009 | 66.0% | 66.0% | 72.0% |
| Science Test | |||
| 2009 | 48.0% | 48.0% | 34.0% |
| 2008 | 62.0% | 62.0% | - |
Grade 2012 Cohort - % of students at or above proficiency
| School | District | State | |
|---|---|---|---|
| Math Test | |||
| 2010 | 50.0% | 50.0% | 59.0% |
| Reading Test | |||
| 2010 | 85.0% | 85.0% | 77.0% |
| Science Test | |||
| 2010 | 50.0% | 50.0% | 35.0% |
| 2009 | 50.0% | 50.0% | 56.0% |
| Writing Test | |||
| 2010 | 72.0% | 72.0% | 72.0% |
Grade 2013 Cohort - % of students at or above proficiency
| School | District | State | |
|---|---|---|---|
| Science Test | |||
| 2010 | 42.0% | 42.0% | 62.0% |
HS - % of students at or above proficiency
| School | District | State | |
|---|---|---|---|
| Math Test | |||
| 2009 | 60.0% | 60.0% | 71.0% |
| 2008 | 59.0% | 59.0% | 58.0% |
| Reading Test | |||
| 2009 | 89.0% | 89.0% | 75.0% |
| 2008 | 75.0% | 75.0% | 66.0% |
| Science Test | |||
| 2009 | 49.0% | 49.0% | 39.0% |
| 2008 | 52.0% | 52.0% | 37.0% |
| Writing Test | |||
| 2009 | 63.0% | 63.0% | 64.0% |
| 2008 | 69.0% | 69.0% | 63.0% |
Grade 2010 Cohort - % of students at or above proficiency
| School | District | State | |
|---|---|---|---|
| Math Test | |||
| 2009 | 46.0% | 46.0% | 38.0% |
| 2008 | 65.0% | 65.0% | - |
| Reading Test | |||
| 2009 | 64.0% | 64.0% | 57.0% |
| 2008 | 85.0% | 85.0% | - |
| Writing Test | |||
| 2009 | 50.0% | 50.0% | 48.0% |
| 2008 | 71.0% | 71.0% | - |
| Science Test | |||
| 2008 | 51.0% | 51.0% | - |
Grade 10 - % of students at or above proficiency
| School | District | State | |
|---|---|---|---|
| Math Test | |||
| 2008 | 53.0% | 53.0% | 67.0% |
| Reading Test | |||
| 2008 | 75.0% | 75.0% | 73.0% |
| Writing Test | |||
| 2008 | 68.0% | 68.0% | 68.0% |
Grade 2009 Cohort - % of students at or above proficiency
| School | District | State | |
|---|---|---|---|
| Math Test | |||
| 2008 | 25.0% | 25.0% | - |
| Reading Test | |||
| 2008 | 75.0% | 75.0% | - |
| Writing Test | |||
| 2008 | 76.0% | 76.0% | - |
Source: AZ Department of Education 2009-2010
School Map and Similar Schools Nearby
Click to Activate Map of Nearby School Campuses
Private
Public
This School
Similar Schools Nearby
| Genesis Academy 9-12 | 176 Students | 0.8 miles away | Not Yet Rated | |
| New World Educational Center School KG-12 | 262 Students | 0.9 miles away | ![]() 4.5 out of 5 | |
| Metropolitan Arts Institute School 7-12 | 250 Students | 0.9 miles away | Not Yet Rated | |
| Teacher Preparation Charter High School 9-12 | 78 Students | 1.0 miles away | Not Yet Rated | |
| Career Success High School - Copper Square 9-12 | 89 Students | 1.3 miles away | Not Yet Rated | |
| Arizona Call-A-Teen Center for Excellence School 9-12 | 117 Students | 1.6 miles away | Not Yet Rated | |
| Crittenton Youth Academy 6-12 | 187 Students | 2.3 miles away | Not Yet Rated | |
| School for Integrated Academics and Technologies 11-12 | 239 Students | 2.3 miles away | Not Yet Rated | |
| Great Hearts Academies - Teleos Preparatory School 3-12 | 245 Students | 2.4 miles away | Not Yet Rated | |
| Amerischools Academy - Camelback KG-12 | 189 Students | 2.5 miles away | Not Yet Rated | |
Compare This School To Nearby Schools ->
School Community Forum

Join a discussion about Arizona Virtual Academy and talk to others in the community including students, parents, teachers, and administrators.
Popular Discussion Topics
- Admissions and Registration Questions (e.g. Dress Code and Discipline Policy)
- School Calendar and Upcoming Events (e.g. Graduation)
- After School Programs, Extracurricular Activities, and Athletics (e.g. Football)
- News and Announcements (e.g. Yearbook and Class Supply List Details)
- Graduate and Alumni Events (e.g. Organizing Class Reunions)
Navigation
Can't Find What You Are Looking For?
Nearby Cities
Sponsored Links
K-12 Articles
Keeping Our Kids Safe in the Post 9/11 World
Recently, radio talk show host and CNN personality did a week-long special entitled "The Perfect...
Simple Math ... a Simple Gift
Math affects every aspect of our lives-from balancing the checkbook to estimating the amount of...
Teacher Tenure: A Double-Edged Sword
Teacher Tenure (the policy making it almost impossible to fire teachers) has noble roots. It was...

