Temecula Preparatory School
Rating
Not Available
Not Available

1 out of 5 | 1 Review
Find Old Friends From Temecula Preparatory School
Use the form below to search for alumni from Temecula Preparatory School.
School Description
School Summary and Highlights
- Enrolls 696 elementary, middle, and high school students from grades KG-12
- Ranks 345th out of 1,197 high schools in CA.
- 2010 Overall School AYP Met Status: Yes
Additional Contact Information
- Mailing Address: 35777 Abelia St., Winchester, CA 92596
School Operational Details
- Charter School
School District Details
- Temecula Valley Unified School District
- Per-Pupil Spending: $7,717
- Graduation Rate: 90.4%
- Dropout Rate: 1.6%
- Students Per Teacher: 22.4
- Enrolled Students: 30,139
Faculty Details and Student Enrollment
Students and Faculty
- Total Students Enrolled: 696
- Total Full Time "Equivalent" Teachers: 37.7
- Average Student-To-Teacher Ratio: 18.5
Students Gender Breakdown
- Males: 322 (46.3%)
- Females: 374 (53.7%)
Free Lunch Student Eligibility Breakdown
- Eligible for Reduced Lunch: 3 (0.4%)
- Eligible for Free Lunch: - (-)
- Eligible for Either Reduced or Free Lunch: 3 (0.4%)
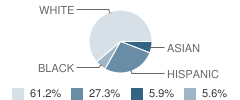
Student Enrollment Distribution by Race / Ethnicity
| Number | Percent | |
|---|---|---|
| American Indian | - | - |
| Black | 36 | 5.2% |
| Asian | 38 | 5.5% |
| Hispanic | 176 | 25.3% |
| White | 395 | 56.8% |
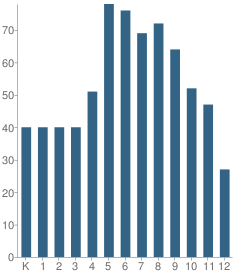
Number of Students Per Grade
| Number | Percent | |
|---|---|---|
| Kindergarten | 40 | 5.7% |
| 1st Grade | 40 | 5.7% |
| 2nd Grade | 40 | 5.7% |
| 3rd Grade | 40 | 5.7% |
| 4th Grade | 51 | 7.3% |
| 5th Grade | 78 | 11.2% |
| 6th Grade | 76 | 10.9% |
| 7th Grade | 69 | 9.9% |
| 8th Grade | 72 | 10.3% |
| 9th Grade | 64 | 9.2% |
| 10th Grade | 52 | 7.5% |
| 11th Grade | 47 | 6.8% |
| 12th Grade | 27 | 3.9% |
Teacher Education Background (2009)
Percent With Master's Degree
School:
30.6%
District:
31.0%
Percent With Bachelor's Degree: 5.6%
Percent With Ph.D.
School:
2.8%
District:
3.4%
Teacher Credentials & Experience (2009)
Average Age
School:
40.3
District:
45.4
Average Number of Years of Teacher Experience: 7.9
Number of Certificated Staff: 36.0
Percent of Teachers With Credentials: 97.0%
Source: CA Department of Education, Source: NCES 2009-2010
School Ratings and Reviews
Overall Rating: 1

1 out of 5 | 1 Review
The Overall Rating is the school's average rating from parents, students, school faculty and staff. The highest rating is five apples and the lowest is one apple.
Share Your Review About This School
1 review for Temecula Preparatory School
- Reviewed by Parent/Guardian on August 20, 2010
- Rating:
 (1 / 5) Flag as inappropriate
 - 1 out of 5 stars
My son attended this school since K, 4 days into 7th grade I had to pull him out. reason 1- Shocking turn over rate among teachers. 2- School terminate well experienced teachers to bring in none credentialed teachers (a few of those). 3- Cannot trust a LAWYER to oversee my child's education. It doesn't look good TPS. That is my personal opinion.
School Map and Similar Schools Nearby
Click to Activate Map of Nearby School Campuses
Private
Public
This School
Similar Schools Nearby
| Santa Rosa Academy KG-12 | 573 Students | 6.2 miles away | Not Yet Rated | |
| Mercury On-Line Academy of Southern California KG-10 | 77 Students | 8.0 miles away | Not Yet Rated | - |
| Eagles Peak Charter School Inland Empire KG-12 | 3,807 Students | 8.6 miles away | Not Yet Rated | |
| Hemet Academy for Applied Academics and Technology 9-12 | 213 Students | 12.2 miles away |  5 out of 5 | - |
| Rainbow Advanced Institute for Learning School KG-12 | 136 Students | 14.0 miles away | Not Yet Rated | |
| Choice 2000 On-Line School 7-12 | 234 Students | 14.3 miles away | Not Yet Rated | |
| San Jacinto Valley Academy KG-12 | 596 Students | 14.7 miles away | 5 out of 5 | |
| California Military Institute School 7-12 | 542 Students | 15.0 miles away | Not Yet Rated | |
| Nuview Bridge Academy 9-12 | 351 Students | 15.2 miles away | Not Yet Rated | |
Compare This School To Nearby Schools ->
School Community Forum

Join a discussion about Temecula Preparatory School and talk to others in the community including students, parents, teachers, and administrators.
Popular Discussion Topics
- Admissions and Registration Questions (e.g. Dress Code and Discipline Policy)
- School Calendar and Upcoming Events (e.g. Graduation)
- After School Programs, Extracurricular Activities, and Athletics (e.g. Football)
- News and Announcements (e.g. Yearbook and Class Supply List Details)
- Graduate and Alumni Events (e.g. Organizing Class Reunions)
Navigation
Can't Find What You Are Looking For?
Rankings
Nearby Cities
Sponsored Links
K-12 Articles

Breakfast, Kids and Learning
For generations parents have been telling their kids that breakfast is the most important meal of...
For generations parents have been telling their kids that breakfast is the most important meal of...

Where in the World is Carmen Sandiego?
One of the sensations on YouTube highlights the state of our education system. The spot was...
One of the sensations on YouTube highlights the state of our education system. The spot was...

Is Your Child Happy at School?
As a parent, you’d love to have your child share all of his feelings with you. It would be so easy...
As a parent, you’d love to have your child share all of his feelings with you. It would be so easy...