Compton High School

5 out of 5 | 1 Review
Find Old Friends From Compton High School
Use the form below to search for alumni from Compton High School.
School Description
School Summary and Highlights
- Enrolls 2,469 high school students from grades 9-12
- Ranks 1142nd out of 1,197 high schools in CA.
- 2010 Overall School AYP Met Status: No
Additional Contact Information
- Mailing Address: 601 South Acacia St., Compton, CA 90220
School Operational Details
- Title I EligibleAll students of this school are eligible for participation in authorized programs.
School District Details
- Compton Unified School District
- Per-Pupil Spending: $9,296
- Graduation Rate: 38.4%
- Dropout Rate: 12.8%
- Students Per Teacher: 18.8
- Enrolled Students: 26,531
Faculty Details and Student Enrollment
Students and Faculty
- Total Students Enrolled: 2,469
- Total Full Time "Equivalent" Teachers: 101.0
- Average Student-To-Teacher Ratio: 24.5
Students Gender Breakdown
- Males: 1,236 (50.1%)
- Females: 1,233 (49.9%)
Free Lunch Student Eligibility Breakdown
- Eligible for Reduced Lunch: 187 (7.6%)
- Eligible for Free Lunch: 1,401 (56.7%)
- Eligible for Either Reduced or Free Lunch: 1,588 (64.3%)
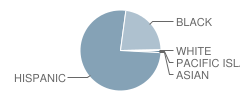
Student Enrollment Distribution by Race / Ethnicity

| Number | Percent | |
|---|---|---|
| American Indian | - | - |
| Black | 552 | 22.4% |
| Asian | 2 | 0.08% |
| Hispanic | 1,865 | 75.5% |
| White | 7 | 0.3% |
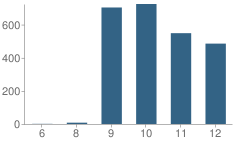
Number of Students Per Grade

| Number | Percent | |
|---|---|---|
| 6th Grade | 1 | 0.04% |
| 8th Grade | 8 | 0.3% |
| 9th Grade | 703 | 28.5% |
| 10th Grade | 724 | 29.3% |
| 11th Grade | 548 | 22.2% |
| 12th Grade | 485 | 19.6% |
Graduates Information (2010)
Graduation Rate
School:
52.1%
District:
47.3%
State:
78.6%
Teacher Education Background (2009)
Percent With Ph.D.
School:
7.0%
District:
13.5%
Percent With Master's Degree
School:
19.0%
District:
23.0%
Percent With Bachelor's Degree
School:
9.0%
District:
1.4%
Teacher Credentials & Experience (2009)
Percent of Teachers With Emergency Credentials: 8.1%
Percent of Teachers With Credentials: 80.2%
Number of Certificated Staff: 100.0
Average Number of Years of Teacher Experience: 12.3
Average Age
School:
43.1
District:
44.8
Source: CA Department of Education, Source: NCES 2009-2010
Sponsored Links
Test Scores and Performance Information
Overall School Rating
How is this determined?
The overall school rating shows that Compton High School performed on average much worse than most other schools across the state on CST state exams in the following subjects:
- CST Algebra I
- CST Algebra II
- CST Biology
- CST Chemistry
- CST Earth Science
- CST English-Language Arts
- CST General Mathematics
- CST Geometry
- CST Science
- CST Summative High School Math
- CST U.S. History
- CST World History
AYP Results (2010)
Overall AYP Met: No
ELA AYP Met: No
Math AYP Met: No
Program Improvement (PI) Requirement Under NCLB (2010)
First Year PI Requirement was Implemented: 1997-1998
School's Placement Under NCLB: Year 5
ACT Exam Results (2009)
Percent of Students Taking ACT Exam: 20.8%
Average Combined Score: 16.0
Percent Scoring At or Above 21: 5.5%
SAT Exam Results (2009)
Percent of Students Taking SAT Exam: 36.2%
Average Combined Score: 1,146.0
Critical Reading Average: 375.9
Math Average: 384.0
Writing Average: 386.1
Percent Scoring At or Above 1500: 5.7%
CST - Test Proficiency by Grade and Subject
Grade 9 - % of students at or above proficiency
| School | District | State | |
|---|---|---|---|
| CST Algebra I Test | |||
| 2010 | 7.0% | 6.0% | 22.0% |
| 2009 | 5.0% | 8.0% | 21.0% |
| 2008 | 2.0% | 5.0% | 18.0% |
| CST Biology Test | |||
| 2010 | 37.0% | 38.0% | 55.0% |
| 2009 | 25.0% | 21.0% | 51.0% |
| 2008 | 20.0% | 19.0% | 52.0% |
| CST English-Language Arts Test | |||
| 2010 | 25.0% | 25.0% | 54.0% |
| 2009 | 17.0% | 19.0% | 50.0% |
| 2008 | 16.0% | 18.0% | 49.0% |
| CST World History Test | |||
| 2010 | 42.0% | 31.0% | 45.0% |
| 2009 | 4.0% | 2.0% | 41.0% |
| 2008 | 2.0% | 2.0% | 36.0% |
| CST General Mathematics Test | |||
| 2009 | 3.0% | 2.0% | 17.0% |
| CST Geometry Test | |||
| 2009 | 2.0% | 8.0% | 47.0% |
| 2008 | 14.0% | 11.0% | 43.0% |
Grade 10 - % of students at or above proficiency
| School | District | State | |
|---|---|---|---|
| CST Algebra I Test | |||
| 2010 | 1.0% | 1.0% | 12.0% |
| 2009 | - | - | - |
| 2008 | 2.0% | 1.0% | 9.0% |
| CST Algebra II Test | |||
| 2010 | 35.0% | 18.0% | 40.0% |
| 2009 | 39.0% | 23.0% | 37.0% |
| 2008 | 14.0% | 13.0% | 36.0% |
| CST Biology Test | |||
| 2010 | 16.0% | 18.0% | 38.0% |
| 2009 | 9.0% | 12.0% | 34.0% |
| 2008 | 8.0% | 11.0% | 35.0% |
| CST Chemistry Test | |||
| 2010 | 3.0% | 4.0% | 47.0% |
| CST English-Language Arts Test | |||
| 2010 | 13.0% | 16.0% | 45.0% |
| 2009 | 15.0% | 13.0% | 44.0% |
| 2008 | 13.0% | 15.0% | 41.0% |
| CST Geometry Test | |||
| 2010 | 1.0% | 2.0% | 14.0% |
| 2009 | - | - | - |
| 2008 | 1.0% | - | 12.0% |
| CST Science Test | |||
| 2010 | 20.0% | 23.0% | 46.0% |
| 2009 | 23.0% | 17.0% | 44.0% |
| 2008 | 9.0% | 13.0% | 40.0% |
| CST World History Test | |||
| 2010 | 15.0% | 15.0% | 42.0% |
| 2009 | 15.0% | 14.0% | 38.0% |
| 2008 | 5.0% | 6.0% | 33.0% |
Grade 11 - % of students at or above proficiency
| School | District | State | |
|---|---|---|---|
| CST Algebra II Test | |||
| 2010 | 2.0% | 10.0% | 14.0% |
| 2009 | 1.0% | 3.0% | 12.0% |
| 2008 | 1.0% | 1.0% | 11.0% |
| CST Biology Test | |||
| 2010 | 14.0% | 8.0% | 46.0% |
| 2009 | 10.0% | 4.0% | 41.0% |
| 2008 | 17.0% | 4.0% | 39.0% |
| CST Chemistry Test | |||
| 2010 | 1.0% | 5.0% | 30.0% |
| 2009 | - | - | - |
| 2008 | 2.0% | 1.0% | 25.0% |
| CST English-Language Arts Test | |||
| 2010 | 17.0% | 15.0% | 42.0% |
| 2009 | 11.0% | 11.0% | 40.0% |
| 2008 | 16.0% | 13.0% | 37.0% |
| CST Summative High School Math Test | |||
| 2010 | 44.0% | 29.0% | 50.0% |
| 2009 | - | - | - |
| 2008 | 14.0% | 15.0% | 43.0% |
| CST U.S. History Test | |||
| 2010 | 20.0% | 20.0% | 45.0% |
| 2009 | 11.0% | 12.0% | 44.0% |
| 2008 | 11.0% | 9.0% | 38.0% |
End of Course - % of students at or above proficiency
| School | District | State | |
|---|---|---|---|
| CST Algebra I Test | |||
| 2010 | 6.0% | 12.0% | 31.0% |
| 2009 | 4.0% | 10.0% | 28.0% |
| 2008 | 2.0% | 7.0% | 25.0% |
| CST Algebra II Test | |||
| 2010 | 3.0% | 11.0% | 31.0% |
| 2009 | 3.0% | 5.0% | 28.0% |
| 2008 | 2.0% | 3.0% | 27.0% |
| CST Biology Test | |||
| 2010 | 20.0% | 19.0% | 46.0% |
| 2009 | 12.0% | 11.0% | 42.0% |
| 2008 | 11.0% | 12.0% | 42.0% |
| CST Chemistry Test | |||
| 2010 | 1.0% | 5.0% | 38.0% |
| 2009 | - | - | - |
| 2008 | 1.0% | 1.0% | 32.0% |
| CST Earth Science Test | |||
| 2010 | 4.0% | 8.0% | 33.0% |
| CST Geometry Test | |||
| 2010 | 1.0% | 3.0% | 27.0% |
| 2009 | - | - | - |
| 2008 | 1.0% | 1.0% | 24.0% |
| CST Summative High School Math Test | |||
| 2010 | 44.0% | 29.0% | 54.0% |
| 2009 | 9.0% | 11.0% | 50.0% |
| 2008 | 14.0% | 15.0% | 47.0% |
| CST World History Test | |||
| 2010 | 17.0% | 16.0% | 41.0% |
| 2009 | 14.0% | 13.0% | 38.0% |
| 2008 | 5.0% | 5.0% | 33.0% |
| CST General Mathematics Test | |||
| 2009 | 3.0% | 6.0% | 26.0% |
Source: CA Department of Education 2009-2010
School Map and Similar Schools Nearby
Click to Activate Map of Nearby School Campuses
Private
Public
This School
Similar Schools Nearby
| Thurgood Marshall School KG-12 | 14 Students | 2.1 miles away | ![]() 5 out of 5 | - |
| Centennial High School 9-12 | 1,367 Students | 2.3 miles away | ![]() 4 out of 5 | |
| California Academy of Mathematics and Science 9-12 | 625 Students | 2.5 miles away | ![]() 5 out of 5 | |
| Dominguez High School 9-12 | 2,413 Students | 2.6 miles away | ![]() 4.5 out of 5 | |
| Jordan High School 9-12 | 4,056 Students | 2.6 miles away | Not Yet Rated | |
| International Studies Learning Community School 6-12 | 782 Students | 3.5 miles away | Not Yet Rated | |
| Jordan New Technology High School 9-12 | 237 Students | 3.6 miles away | Not Yet Rated | - |
| South East High School 9-12 | 2,855 Students | 3.8 miles away | ![]() 5 out of 5 | |
| Gardena High School 9-12 | 2,806 Students | 4.3 miles away | Not Yet Rated | |
| Paramount High School 9-12 | 4,758 Students | 4.4 miles away | ![]() 5 out of 5 | |
Compare This School To Nearby Schools ->
School Community Forum

Join a discussion about Compton High School and talk to others in the community including students, parents, teachers, and administrators.
Popular Discussion Topics
- Admissions and Registration Questions (e.g. Dress Code and Discipline Policy)
- School Calendar and Upcoming Events (e.g. Graduation)
- After School Programs, Extracurricular Activities, and Athletics (e.g. Football)
- News and Announcements (e.g. Yearbook and Class Supply List Details)
- Graduate and Alumni Events (e.g. Organizing Class Reunions)
Navigation
Can't Find What You Are Looking For?
Rankings
Nearby Cities
Sponsored Links
K-12 Articles
Cut the Credit and Save You Some Money
Today's society glorifies a get-it-now mentality. Children learn this early. You probably noticed...
Internet Safety for Kids of All Ages
Kids are being introduced to the Internet at a very young age. Research for homework and school...
Asperger Syndrome: A Developmental Disorder on the Autism Spectrum
Asperger Syndrome, also known as Pervasive Developmental Disorder is on the high functioning end of...


(5 / 5) 

