Charles Drew Middle School
Rating
Not Available
Not Available

No Reviews Yet
Find Old Friends From Charles Drew Middle School
Use the form below to search for alumni from Charles Drew Middle School.
School Description
School Summary and Highlights
- Enrolls 1,938 middle school students from grades 6-8
- Ranks 2024th out of 2,050 middle schools in CA.
- 2010 Overall School AYP Met Status: No
Additional Contact Information
- Mailing Address: 8511 Compton Ave., Los Angeles, CA 90001
School Operational Details
- Title I EligibleAll students of this school are eligible for participation in authorized programs.
School District Details
- Los Angeles Unified School District
- Per-Pupil Spending: $11,357
- Graduation Rate: 48.8%
- Dropout Rate: 6.8%
- Students Per Teacher: 21.3
- Enrolled Students: 667,870
Faculty Details and Student Enrollment
Students and Faculty
- Total Students Enrolled: 1,938
- Total Full Time "Equivalent" Teachers: 98.0
- Average Student-To-Teacher Ratio: 19.8
Students Gender Breakdown
- Males: 966 (49.8%)
- Females: 972 (50.2%)
Free Lunch Student Eligibility Breakdown
- Eligible for Reduced Lunch: 40 (2.1%)
- Eligible for Free Lunch: 1,694 (87.4%)
- Eligible for Either Reduced or Free Lunch: 1,734 (89.5%)
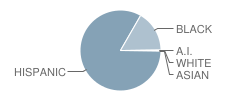
Student Enrollment Distribution by Race / Ethnicity
| Number | Percent | |
|---|---|---|
| American Indian | 4 | 0.2% |
| Black | 319 | 16.5% |
| Asian | 1 | 0.05% |
| Hispanic | 1,608 | 83.0% |
| White | 4 | 0.2% |
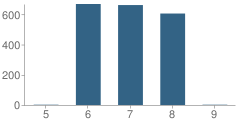
Number of Students Per Grade
| Number | Percent | |
|---|---|---|
| 5th Grade | 2 | 0.1% |
| 6th Grade | 668 | 34.5% |
| 7th Grade | 661 | 34.1% |
| 8th Grade | 605 | 31.2% |
| 9th Grade | 2 | 0.1% |
Teacher Education Background (2009)
Percent With Ph.D.
School:
1.5%
District:
3.7%
Percent With Master's Degree
School:
15.4%
District:
26.9%
Percent With Bachelor's Degree
School:
30.0%
District:
31.9%
Teacher Credentials & Experience (2009)
Percent of Teachers With Credentials: 91.2%
Number of Certificated Staff: 130.0
Average Number of Years of Teacher Experience: 7.5
Average Age
School:
39.7
District:
46.7
Source: CA Department of Education, Source: NCES 2009-2010
School Ratings and Reviews
Be The First To Review Charles Drew Middle School!
School Map and Similar Schools Nearby
Click to Activate Map of Nearby School Campuses
Private
Public
This School
Similar Schools Nearby
| Edwin Markham Middle School 6-8 | 1,263 Students | 1.4 miles away | Not Yet Rated | |
| Thomas A. Edison Middle School 6-8 | 1,613 Students | 1.4 miles away | Not Yet Rated | |
| Southeast Middle School 6-8 | 1,356 Students | 1.6 miles away | Not Yet Rated | |
| Middleton Street Elementary School KG-6 | 1,447 Students | 1.7 miles away |  1 out of 5 | |
| Mary Mcleod Bethune Middle School 6-8 | 2,141 Students | 1.8 miles away | Not Yet Rated | |
| International Studies Learning Community School 6-12 | 782 Students | 1.8 miles away | Not Yet Rated | |
| Henry T. Gage Middle School 6-8 | 2,578 Students | 2.2 miles away | Not Yet Rated | |
| Los Angeles Academy Middle 6-8 | 2,149 Students | 2.3 miles away | Not Yet Rated | |
| Bret Harte Preparatory Intermediate School 6-8 | 1,221 Students | 2.3 miles away |  2 out of 5 | |
| Samuel Gompers Middle School 6-8 | 1,449 Students | 2.6 miles away | Not Yet Rated | |
Compare This School To Nearby Schools ->
School Community Forum

Join a discussion about Charles Drew Middle School and talk to others in the community including students, parents, teachers, and administrators.
Popular Discussion Topics
- Admissions and Registration Questions (e.g. Dress Code and Discipline Policy)
- School Calendar and Upcoming Events (e.g. Graduation)
- After School Programs, Extracurricular Activities, and Athletics (e.g. Football)
- News and Announcements (e.g. Yearbook and Class Supply List Details)
- Graduate and Alumni Events (e.g. Organizing Class Reunions)
Navigation
Can't Find What You Are Looking For?
Rankings
Nearby Cities
Sponsored Links
K-12 Articles

The Difference Between Boys and Girls
Boys and girls are different. Give a toddler girl a G.I. Joe and she'll probably try to mother it....
Boys and girls are different. Give a toddler girl a G.I. Joe and she'll probably try to mother it....

Siblings and Individual Identity in High School
When the first day of high school looms in the near future, teens are both excited and anxious....
When the first day of high school looms in the near future, teens are both excited and anxious....

The Adolescent Monster
“What happened to my sweet little baby?” Every parent has or will ask that sometime during the...
“What happened to my sweet little baby?” Every parent has or will ask that sometime during the...