George Washington Preparatory High School
10860 South Denker Ave, Los Angeles, CA 90047 | (323) 418-4000
- Grades: 9-12
- Student Enrollment: 2,130
Rating
Not Available
Not Available

4.5 out of 5 | 2 Reviews
Find Old Friends From George Washington Preparatory High School
Use the form below to search for alumni from George Washington Preparatory High School.
School Description
School Summary and Highlights
- Enrolls 2,130 high school students from grades 9-12
- Ranks 1188th out of 1,197 high schools in CA.
- 2010 Overall School AYP Met Status: No
Additional Contact Information
- Mailing Address: 10860 South Denker Ave., Los Angeles, CA 90047
School Operational Details
- Title I EligibleAll students of this school are eligible for participation in authorized programs.
School District Details
- Los Angeles Unified School District
- Per-Pupil Spending: $11,357
- Graduation Rate: 48.8%
- Dropout Rate: 6.8%
- Students Per Teacher: 21.3
- Enrolled Students: 667,870
Faculty Details and Student Enrollment
Students and Faculty
- Total Students Enrolled: 2,130
- Total Full Time "Equivalent" Teachers: 116.6
- Average Student-To-Teacher Ratio: 18.3
Students Gender Breakdown
- Males: 1,074 (50.4%)
- Females: 1,056 (49.6%)
Free Lunch Student Eligibility Breakdown
- Eligible for Reduced Lunch: 54 (2.5%)
- Eligible for Free Lunch: 1,814 (85.2%)
- Eligible for Either Reduced or Free Lunch: 1,868 (87.7%)
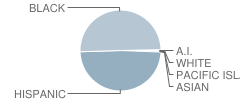
Student Enrollment Distribution by Race / Ethnicity
| Number | Percent | |
|---|---|---|
| American Indian | 5 | 0.2% |
| Black | 1,066 | 50.0% |
| Asian | 4 | 0.2% |
| Hispanic | 1,037 | 48.7% |
| White | 6 | 0.3% |
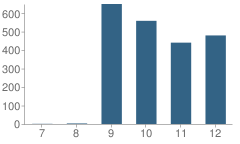
Number of Students Per Grade
| Number | Percent | |
|---|---|---|
| 7th Grade | 1 | 0.05% |
| 8th Grade | 3 | 0.1% |
| 9th Grade | 649 | 30.5% |
| 10th Grade | 558 | 26.2% |
| 11th Grade | 440 | 20.7% |
| 12th Grade | 479 | 22.5% |
Graduates Information (2010)
Graduation Rate
School:
66.4%
District:
69.1%
State:
78.6%
Teacher Education Background (2009)
Percent With Master's Degree
School:
12.3%
District:
26.9%
Percent With Bachelor's Degree
School:
27.2%
District:
31.9%
Percent With Ph.D.
School:
2.5%
District:
3.7%
Teacher Credentials & Experience (2009)
Average Age
School:
43.1
District:
46.7
Average Number of Years of Teacher Experience: 10.0
Number of Certificated Staff: 162.0
Percent of Teachers With Credentials: 92.4%
Source: CA Department of Education, Source: NCES 2009-2010
School Ratings and Reviews
Overall Rating: 4.5

4.5 out of 5 | 2 Reviews
The Overall Rating is the school's average rating from parents, students, school faculty and staff. The highest rating is five apples and the lowest is one apple.
Share Your Review About This School
2 reviews for George Washington Preparatory High School
- Reviewed by Parent/Guardian on October 16, 2010
- Rating:
 (5 / 5) Flag as inappropriate
 - great school
- Reviewed by Former Student on May 22, 2009
- Rating:
 (4 / 5) Flag as inappropriate
 - IM GLAD I WENT HERE I LEARNED A LOT
School Map and Similar Schools Nearby
Click to Activate Map of Nearby School Campuses
Private
Public
This School
Similar Schools Nearby
| Middle College High School 9-12 | 379 Students | 0.8 miles away | Not Yet Rated | |
| Morningside High School 9-12 | 1,323 Students | 1.8 miles away |  4.5 out of 5 | |
| Horace Mann Junior High School 6-8 | 974 Students | 2.7 miles away | Not Yet Rated | |
| John C. Fremont High School 9-12 | 4,470 Students | 3.0 miles away |  5 out of 5 | |
| Centennial High School 9-12 | 1,367 Students | 3.3 miles away |  4 out of 5 | |
| City Honors High School 9-12 | 456 Students | 3.3 miles away | 5 out of 5 | |
| Inglewood High School 9-12 | 1,627 Students | 3.3 miles away | Not Yet Rated | |
| Hawthorne High School 9-12 | 2,299 Students | 3.7 miles away | 5 out of 5 | |
| Leuzinger High School 9-12 | 2,574 Students | 3.7 miles away | 5 out of 5 | |
| Thurgood Marshall School KG-12 | 14 Students | 3.9 miles away | 5 out of 5 | - |
Compare This School To Nearby Schools ->
School Community Forum

Join a discussion about George Washington Preparatory High School and talk to others in the community including students, parents, teachers, and administrators.
Popular Discussion Topics
- Admissions and Registration Questions (e.g. Dress Code and Discipline Policy)
- School Calendar and Upcoming Events (e.g. Graduation)
- After School Programs, Extracurricular Activities, and Athletics (e.g. Football)
- News and Announcements (e.g. Yearbook and Class Supply List Details)
- Graduate and Alumni Events (e.g. Organizing Class Reunions)
Navigation
Can't Find What You Are Looking For?
Rankings
Nearby Cities
Sponsored Links
K-12 Articles

Public or Private?
Daniel attended private school until sixth grade, when he was diagnosed with Asperger’s Syndrome, a...
Daniel attended private school until sixth grade, when he was diagnosed with Asperger’s Syndrome, a...

Simple Math ... a Simple Gift
Math affects every aspect of our lives-from balancing the checkbook to estimating the amount of...
Math affects every aspect of our lives-from balancing the checkbook to estimating the amount of...

When Bad Report Cards Happen to Good Kids
It’s mid-term season once again, and semester (or quarter or trimester) grades will be coming out...
It’s mid-term season once again, and semester (or quarter or trimester) grades will be coming out...