Chaparral High School
Rating
Not Available
Not Available

No Reviews Yet
Find Old Friends From Chaparral High School
Use the form below to search for alumni from Chaparral High School.
School Description
School Summary and Highlights
- Enrolls 3,121 high school students from grades 9-12
- Ranks 252nd out of 1,197 high schools in CA.
- 2010 Overall School AYP Met Status: Yes
Additional Contact Information
- Mailing Address: 27215 Nicolas Rd., Temecula, CA 92591
School District Details
- Temecula Valley Unified School District
- Per-Pupil Spending: $7,717
- Graduation Rate: 90.4%
- Dropout Rate: 1.6%
- Students Per Teacher: 22.4
- Enrolled Students: 30,139
Faculty Details and Student Enrollment
Students and Faculty
- Total Students Enrolled: 3,121
- Total Full Time "Equivalent" Teachers: 130.6
- Average Student-To-Teacher Ratio: 23.9
Students Gender Breakdown
- Males: 1,550 (49.7%)
- Females: 1,571 (50.3%)
Free Lunch Student Eligibility Breakdown
- Eligible for Reduced Lunch: 160 (5.1%)
- Eligible for Free Lunch: 328 (10.5%)
- Eligible for Either Reduced or Free Lunch: 488 (15.6%)
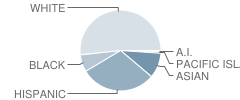
Student Enrollment Distribution by Race / Ethnicity
| Number | Percent | |
|---|---|---|
| American Indian | 20 | 0.6% |
| Black | 207 | 6.6% |
| Asian | 301 | 9.6% |
| Hispanic | 893 | 28.6% |
| White | 1,522 | 48.8% |
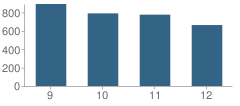
Number of Students Per Grade
| Number | Percent | |
|---|---|---|
| 9th Grade | 892 | 28.6% |
| 10th Grade | 790 | 25.3% |
| 11th Grade | 776 | 24.9% |
| 12th Grade | 663 | 21.2% |
Graduates Information (2010)
Graduation Rate
School:
95.8%
District:
92.7%
State:
78.6%
Teacher Education Background (2009)
Percent With Master's Degree
School:
49.3%
District:
31.0%
Percent With Bachelor's Degree: 2.1%
Percent With Ph.D.
School:
71.4%
District:
3.4%
Teacher Credentials & Experience (2009)
Average Age
School:
43.6
District:
45.4
Average Number of Years of Teacher Experience: 16.1
Number of Certificated Staff: 140.0
Percent of Teachers With Credentials: 96.0%
Source: CA Department of Education, Source: NCES 2009-2010
School Ratings and Reviews
Be The First To Review Chaparral High School!
School Map and Similar Schools Nearby
Click to Activate Map of Nearby School Campuses
Private
Public
This School
Similar Schools Nearby
| Temecula Valley High School 9-12 | 2,807 Students | 3.0 miles away | Not Yet Rated | |
| Murrieta Mesa High School 9-12 | 1,112 Students | 3.6 miles away | Not Yet Rated | - |
| Vista Murrieta High School 9-12 | 3,388 Students | 4.4 miles away | Not Yet Rated | |
| Murrieta Valley High School 9-12 | 2,695 Students | 5.1 miles away |  5 out of 5 | |
| Great Oak High School 9-12 | 3,296 Students | 6.7 miles away | 5 out of 5 | |
| Paloma Valley High School 9-12 | 2,717 Students | 9.1 miles away |  3 out of 5 | |
| Elsinore High School 9-12 | 2,356 Students | 9.6 miles away | 3 out of 5 | |
| Fallbrook High School 9-12 | 2,790 Students | 14.2 miles away | Not Yet Rated | |
| Heritage High School 9-12 | 2,529 Students | 14.2 miles away |  2 out of 5 | - |
| West Valley High School 9-12 | 1,896 Students | 14.9 miles away | Not Yet Rated | |
Compare This School To Nearby Schools ->
School Community Forum

Join a discussion about Chaparral High School and talk to others in the community including students, parents, teachers, and administrators.
Popular Discussion Topics
- Admissions and Registration Questions (e.g. Dress Code and Discipline Policy)
- School Calendar and Upcoming Events (e.g. Graduation)
- After School Programs, Extracurricular Activities, and Athletics (e.g. Football)
- News and Announcements (e.g. Yearbook and Class Supply List Details)
- Graduate and Alumni Events (e.g. Organizing Class Reunions)
Navigation
Can't Find What You Are Looking For?
Rankings
Nearby Cities
Sponsored Links
K-12 Articles

Cut the Credit and Save You Some Money
Today’s society glorifies a get-it-now mentality. Children learn this early. You probably noticed...
Today’s society glorifies a get-it-now mentality. Children learn this early. You probably noticed...

Beating the Summer Slump
“The Summer Slump”, teachers call it. It happens every year. It makes its way into lesson plans...
“The Summer Slump”, teachers call it. It happens every year. It makes its way into lesson plans...

Strategies to Help Kids Cope with Stress
Many parents believe that kids don’t experience stress. Nothing could be further from the truth....
Many parents believe that kids don’t experience stress. Nothing could be further from the truth....