La Quinta High School

No Reviews Yet
Find Old Friends From La Quinta High School
Use the form below to search for alumni from La Quinta High School.
School Description
School Summary and Highlights
- Enrolls 2,985 high school students from grades 9-12
- Ranks 226th out of 1,197 high schools in CA.
- 2010 Overall School AYP Met Status: Yes
Additional Contact Information
- Mailing Address: 79-255 Westward Ho Dr., La Quinta, CA 92253
School District Details
- Desert Sands Unified School District
- Per-Pupil Spending: $8,684
- Graduation Rate: 82.3%
- Dropout Rate: 4.1%
- Students Per Teacher: 23.7
- Enrolled Students: 29,314
Faculty Details and Student Enrollment
Students and Faculty
- Total Students Enrolled: 2,985
- Total Full Time "Equivalent" Teachers: 109.0
- Average Student-To-Teacher Ratio: 27.4
Students Gender Breakdown
- Males: 1,443 (48.3%)
- Females: 1,542 (51.7%)
Free Lunch Student Eligibility Breakdown
- Eligible for Reduced Lunch: 338 (11.3%)
- Eligible for Free Lunch: 839 (28.1%)
- Eligible for Either Reduced or Free Lunch: 1,177 (39.4%)
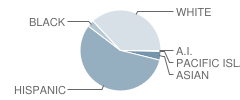
Student Enrollment Distribution by Race / Ethnicity

| Number | Percent | |
|---|---|---|
| American Indian | 10 | 0.3% |
| Black | 81 | 2.7% |
| Asian | 104 | 3.5% |
| Hispanic | 1,672 | 56.0% |
| White | 1,094 | 36.6% |
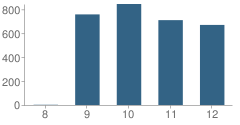
Number of Students Per Grade

| Number | Percent | |
|---|---|---|
| 8th Grade | 2 | 0.07% |
| 9th Grade | 758 | 25.4% |
| 10th Grade | 845 | 28.3% |
| 11th Grade | 710 | 23.8% |
| 12th Grade | 670 | 22.4% |
Graduates Information (2010)
Graduation Rate
School:
96.5%
District:
84.3%
State:
78.6%
Teacher Education Background (2009)
Percent With Ph.D.
School:
3.1%
District:
11.5%
Percent With Master's Degree
School:
38.8%
District:
42.5%
Percent With Bachelor's Degree
School:
26.4%
District:
17.2%
Teacher Credentials & Experience (2009)
Percent of Teachers With Emergency Credentials: 5.1%
Percent of Teachers With Credentials: 94.0%
Number of Certificated Staff: 129.0
Average Number of Years of Teacher Experience: 11.9
Average Age
School:
44.9
District:
49.4
Source: CA Department of Education, Source: NCES 2009-2010
School Ratings and Reviews
Be The First To Review La Quinta High School!
Sponsored Links
Test Scores and Performance Information
Overall School Rating
How is this determined?
The overall school rating shows that La Quinta High School performed on average better than many other schools across the state on CST state exams in the following subjects:
- CST Algebra I
- CST Algebra II
- CST Biology
- CST Chemistry
- CST Earth Science
- CST English-Language Arts
- CST Geometry
- CST Integrated Math 1
- CST Integrated Math 2
- CST Physics
- CST Science
- CST Summative High School Math
- CST U.S. History
- CST World History
AYP Results (2010)
Overall AYP Met: Yes
ELA AYP Met: Yes
Math AYP Met: Yes
ACT Exam Results (2009)
Percent of Students Taking ACT Exam: 15.2%
Average Combined Score: 21.1
Percent Scoring At or Above 21: 56.6%
SAT Exam Results (2009)
Percent of Students Taking SAT Exam: 46.0%
Average Combined Score: 1,472.5
Critical Reading Average: 494.6
Math Average: 496.4
Writing Average: 481.6
Percent Scoring At or Above 1500: 45.5%
CST - Test Proficiency by Grade and Subject
Grade 9 - % of students at or above proficiency
| School | District | State | |
|---|---|---|---|
| CST Algebra I Test | |||
| 2010 | 25.0% | 15.0% | 22.0% |
| 2009 | 14.0% | 13.0% | 21.0% |
| 2008 | 14.0% | 12.0% | 18.0% |
| CST Algebra II Test | |||
| 2010 | 81.0% | 82.0% | 69.0% |
| CST Biology Test | |||
| 2010 | 94.0% | 50.0% | 55.0% |
| 2009 | 91.0% | 43.0% | 51.0% |
| 2008 | 84.0% | 69.0% | 52.0% |
| CST Earth Science Test | |||
| 2010 | 49.0% | 43.0% | 35.0% |
| 2009 | 33.0% | 36.0% | 29.0% |
| 2008 | 32.0% | 25.0% | 31.0% |
| CST English-Language Arts Test | |||
| 2010 | 65.0% | 57.0% | 54.0% |
| 2009 | 56.0% | 49.0% | 50.0% |
| 2008 | 56.0% | 50.0% | 49.0% |
| CST Geometry Test | |||
| 2010 | 60.0% | 40.0% | 46.0% |
| 2009 | 77.0% | 48.0% | 47.0% |
| 2008 | 49.0% | 37.0% | 43.0% |
| CST World History Test | |||
| 2010 | 83.0% | 73.0% | 45.0% |
| 2009 | 72.0% | 69.0% | 41.0% |
| 2008 | 66.0% | 57.0% | 36.0% |
Grade 10 - % of students at or above proficiency
| School | District | State | |
|---|---|---|---|
| CST Algebra I Test | |||
| 2010 | 6.0% | 6.0% | 12.0% |
| 2009 | 4.0% | 4.0% | 11.0% |
| 2008 | 3.0% | 4.0% | 9.0% |
| CST Algebra II Test | |||
| 2010 | 57.0% | 41.0% | 40.0% |
| 2009 | 49.0% | 36.0% | 37.0% |
| 2008 | 56.0% | 41.0% | 36.0% |
| CST Biology Test | |||
| 2010 | 50.0% | 42.0% | 38.0% |
| 2009 | 37.0% | 28.0% | 34.0% |
| 2008 | 36.0% | 31.0% | 35.0% |
| CST Chemistry Test | |||
| 2010 | 79.0% | 53.0% | 47.0% |
| 2009 | 73.0% | 65.0% | 44.0% |
| 2008 | 61.0% | 47.0% | 41.0% |
| CST Earth Science Test | |||
| 2010 | 76.0% | 34.0% | 29.0% |
| 2009 | 50.0% | 38.0% | 23.0% |
| 2008 | 41.0% | 30.0% | 23.0% |
| CST English-Language Arts Test | |||
| 2010 | 56.0% | 49.0% | 45.0% |
| 2009 | 54.0% | 43.0% | 44.0% |
| 2008 | 54.0% | 45.0% | 41.0% |
| CST Geometry Test | |||
| 2010 | 15.0% | 12.0% | 14.0% |
| 2009 | 20.0% | 11.0% | 14.0% |
| 2008 | 7.0% | 8.0% | 12.0% |
| CST Integrated Math 1 Test | |||
| 2010 | 15.0% | 9.0% | 11.0% |
| 2009 | 5.0% | 4.0% | 9.0% |
| 2008 | 4.0% | 2.0% | 10.0% |
| CST Integrated Math 2 Test | |||
| 2010 | 58.0% | 45.0% | 41.0% |
| CST Science Test | |||
| 2010 | 66.0% | 54.0% | 46.0% |
| 2009 | 53.0% | 43.0% | 44.0% |
| 2008 | 48.0% | 41.0% | 40.0% |
| CST World History Test | |||
| 2010 | 44.0% | 39.0% | 42.0% |
| 2009 | 34.0% | 29.0% | 38.0% |
| 2008 | 29.0% | 26.0% | 33.0% |
Grade 11 - % of students at or above proficiency
| School | District | State | |
|---|---|---|---|
| CST Algebra II Test | |||
| 2010 | 16.0% | 10.0% | 14.0% |
| 2009 | 9.0% | 8.0% | 12.0% |
| 2008 | 17.0% | 11.0% | 11.0% |
| CST Biology Test | |||
| 2010 | 79.0% | 66.0% | 46.0% |
| 2009 | 64.0% | 49.0% | 41.0% |
| 2008 | 71.0% | 41.0% | 39.0% |
| CST Chemistry Test | |||
| 2010 | 57.0% | 43.0% | 30.0% |
| 2009 | 42.0% | 42.0% | 27.0% |
| 2008 | 31.0% | 27.0% | 25.0% |
| CST Earth Science Test | |||
| 2010 | 50.0% | 42.0% | 32.0% |
| 2009 | 41.0% | 40.0% | 26.0% |
| 2008 | 49.0% | 44.0% | 28.0% |
| CST English-Language Arts Test | |||
| 2010 | 57.0% | 44.0% | 42.0% |
| 2009 | 55.0% | 39.0% | 40.0% |
| 2008 | 50.0% | 38.0% | 37.0% |
| CST Geometry Test | |||
| 2010 | 6.0% | 4.0% | 6.0% |
| 2009 | 9.0% | 5.0% | 7.0% |
| 2008 | 7.0% | 4.0% | 6.0% |
| CST Integrated Math 1 Test | |||
| 2010 | 11.0% | 6.0% | 11.0% |
| 2009 | 13.0% | 4.0% | 9.0% |
| 2008 | 2.0% | 1.0% | 9.0% |
| CST Integrated Math 2 Test | |||
| 2010 | 24.0% | 16.0% | 19.0% |
| 2009 | 22.0% | 22.0% | 15.0% |
| 2008 | 26.0% | 19.0% | 13.0% |
| CST Physics Test | |||
| 2010 | 86.0% | 56.0% | 53.0% |
| 2009 | 63.0% | 48.0% | 50.0% |
| 2008 | 79.0% | 69.0% | 47.0% |
| CST Summative High School Math Test | |||
| 2010 | 40.0% | 42.0% | 50.0% |
| 2009 | 45.0% | 38.0% | 47.0% |
| 2008 | 26.0% | 29.0% | 43.0% |
| CST U.S. History Test | |||
| 2010 | 59.0% | 44.0% | 45.0% |
| 2009 | 60.0% | 43.0% | 44.0% |
| 2008 | 55.0% | 37.0% | 38.0% |
| CST Algebra I Test | |||
| 2009 | 16.0% | 5.0% | 8.0% |
| 2008 | 6.0% | 2.0% | 5.0% |
End of Course - % of students at or above proficiency
| School | District | State | |
|---|---|---|---|
| CST Algebra I Test | |||
| 2010 | 22.0% | 30.0% | 31.0% |
| 2009 | 13.0% | 23.0% | 28.0% |
| 2008 | 11.0% | 26.0% | 25.0% |
| CST Algebra II Test | |||
| 2010 | 37.0% | 29.0% | 31.0% |
| 2009 | 27.0% | 25.0% | 28.0% |
| 2008 | 36.0% | 28.0% | 27.0% |
| CST Biology Test | |||
| 2010 | 64.0% | 49.0% | 46.0% |
| 2009 | 54.0% | 38.0% | 42.0% |
| 2008 | 52.0% | 44.0% | 42.0% |
| CST Chemistry Test | |||
| 2010 | 68.0% | 49.0% | 38.0% |
| 2009 | 54.0% | 54.0% | 36.0% |
| 2008 | 44.0% | 38.0% | 32.0% |
| CST Earth Science Test | |||
| 2010 | 50.0% | 42.0% | 33.0% |
| 2009 | 35.0% | 37.0% | 28.0% |
| 2008 | 36.0% | 31.0% | 28.0% |
| CST Geometry Test | |||
| 2010 | 26.0% | 24.0% | 27.0% |
| 2009 | 37.0% | 28.0% | 26.0% |
| 2008 | 21.0% | 22.0% | 24.0% |
| CST Integrated Math 1 Test | |||
| 2010 | 14.0% | 8.0% | 13.0% |
| 2009 | 7.0% | 4.0% | 11.0% |
| 2008 | 3.0% | 2.0% | 11.0% |
| CST Integrated Math 2 Test | |||
| 2010 | 32.0% | 26.0% | 27.0% |
| 2009 | 28.0% | 25.0% | 25.0% |
| 2008 | 30.0% | 22.0% | 25.0% |
| CST Physics Test | |||
| 2010 | 86.0% | 53.0% | 49.0% |
| 2009 | 63.0% | 48.0% | 46.0% |
| 2008 | 79.0% | 73.0% | 43.0% |
| CST Summative High School Math Test | |||
| 2010 | 40.0% | 45.0% | 54.0% |
| 2009 | 45.0% | 42.0% | 50.0% |
| 2008 | 29.0% | 33.0% | 47.0% |
| CST World History Test | |||
| 2010 | 47.0% | 39.0% | 41.0% |
| 2009 | 37.0% | 28.0% | 38.0% |
| 2008 | 32.0% | 25.0% | 33.0% |
Source: CA Department of Education 2009-2010
School Map and Similar Schools Nearby
Click to Activate Map of Nearby School Campuses
Private
Public
This School
Similar Schools Nearby
| Shadow Hills High School 9-12 | 640 Students | 1.2 miles away | Not Yet Rated | - |
| Indio High School 9-12 | 2,447 Students | 2.7 miles away | Not Yet Rated | |
| Palm Desert High School 9-12 | 2,103 Students | 4.5 miles away | Not Yet Rated | |
| Coachella Valley High School 9-12 | 2,786 Students | 6.9 miles away | Not Yet Rated | |
| Cathedral City High School 9-12 | 2,849 Students | 11.4 miles away | Not Yet Rated | |
| Desert Mirage High School 9-12 | 1,881 Students | 12.2 miles away | ![]() 5 out of 5 | |
| Palm Springs High School 9-12 | 2,158 Students | 15.3 miles away | Not Yet Rated | |
| Desert Hot Springs High School 9-12 | 1,935 Students | 21.6 miles away | ![]() 3 out of 5 | |
| Hamilton High School 9-12 | 393 Students | 23.7 miles away | Not Yet Rated | |
| Yucca Valley High School 9-12 | 1,603 Students | 28.7 miles away | ![]() 5 out of 5 | |
Compare This School To Nearby Schools ->
School Community Forum

Join a discussion about La Quinta High School and talk to others in the community including students, parents, teachers, and administrators.
Popular Discussion Topics
- Admissions and Registration Questions (e.g. Dress Code and Discipline Policy)
- School Calendar and Upcoming Events (e.g. Graduation)
- After School Programs, Extracurricular Activities, and Athletics (e.g. Football)
- News and Announcements (e.g. Yearbook and Class Supply List Details)
- Graduate and Alumni Events (e.g. Organizing Class Reunions)
Navigation
Can't Find What You Are Looking For?
Rankings
Nearby Cities
Sponsored Links
K-12 Articles
Parent-Teacher Conference Dos and Don'ts
Finals are over and done, and grades have arrived. Now comes the dreaded time to discuss the...
Where in the World is Carmen Sandiego?
One of the sensations on YouTube highlights the state of our education system. The spot was...
Tips for Purchasing Back to School Supplies
In just a few days, kids from all over the US will be going back to school. Now is the time to take...


